Data
Data files and developer guide
Everything on this site is also a file. There is no API server, key or sign-up: the files are static, rebuilt with each release of the tracker, and open to browsers on other sites.
The basics
- Static files. Each address below returns a file built at the last release, not a live query. There is no rate limit of our own and no key; please fetch once and keep a copy instead of requesting on every page view.
- Open to browsers. The files are served with
access-control-allow-origin: *, so a page on another site can fetch them. - Attribution is required and travels with the data. The underlying data is Global Energy Monitor's, under CC BY 4.0. Every CSV row has a
data_sourcecolumn, each table's JSON file has anattributionfield, and the GeoJSON files carry it as members. Please keep it wherever you reuse the data, and cite asData: Global Gas Infrastructure Tracker, Global Energy Monitor, September 2025. - Empty means not reported. An empty cell or
nullis a field the tracker does not give. It is never zero, and nothing is estimated. - Capacity is never totalled. Operating, construction and proposed capacity are separate columns, export and import are never combined, and there is no total column.
- Addresses are stable. A slug persists across releases, and a deliberate rename leaves a permanent redirect. Columns may be added over time; existing ones keep their names.
- One tracker release at a time. Each file names the release it is built from (
releasein the JSON, and on the downloads page).
The tables
One row per asset. Each is available as CSV and as JSON with the same columns.
LNG terminals
813 rows from the September 2025 release.CSV ·JSON
23 columns
slug, name, country, country_iso, region, state_province, city, facility_type, floating_type, status, latitude, longitude, units, capacity_operating_mtpa, capacity_construction_mtpa, capacity_proposed_mtpa, capacity_operating_bcm_y, capacity_construction_bcm_y, capacity_proposed_bcm_y, earliest_start_year, latest_start_year, url, data_source
LNG terminal units (trains and phases)
1,206 rows from the September 2025 release.CSV ·JSON
30 columns
terminal_slug, terminal_name, country, country_iso, unit_name, status, facility_type, floating_type, capacity_mtpa, capacity_bcm_y, start_year, planned_start_year, original_planned_start_year, fid_year, construction_year, shelved_year, cancelled_year, stop_year, estimated_cost_usd, estimated_cost_original, estimated_cost_currency, power_stations_supplied, floating_vessel_name, ccs_project, hydrogen_project, ammonia_project, synthetic_lng_project, retrofit_proposed, url, data_source
Gas pipelines
4,246 rows from the November 2025 release.CSV ·JSON
26 columns
slug, name, status, countries, start_country, end_country, start_place, end_place, region, fuel, onshore_offshore, segments, length_km, length_basis, length_km_mapped_route, capacity_bcm_y, diameter_mm, start_year, proposal_year, shelved_year, cancelled_year, estimated_cost_usd, eu_pci_lists, has_route, url, data_source
LNG carriers and floating vessels
1,220 rows from the June 2026 release.CSV ·JSON
20 columns
slug, name, imo, imo_check_digit_valid, status, vessel_type, capacity_m3, shipyard, shipyard_country, delivery_year, containment, containment_family, propulsion, propulsion_family, flag, length_m, gross_tonnage, hull_number, url, data_source
The JSON files are one object: dataset, release, attribution, licence, note, count and rows. The units table is one row per train or phase, the level at which cost, cancelled and shelved years and the low-carbon flags are reported; do not add units of different statuses. How the fields are read is on the downloads pageand in the methodology.
Other files
| Address | Format | What it holds |
|---|---|---|
/api/slug-index.json | JSON | Names and slugs of every terminal, pipeline, carrier, company and supplier, with a generated_at time. |
/api/pipelines.json | JSON | Compact pipeline list: an array of rows [slug, name, countries, route, status, length_km]. |
/api/map/terminals.json | GeoJSON | Terminals with coordinates as a GeoJSON FeatureCollection. Properties: slug, name, status, type, floating, country, country_name, mtpa. Attribution is in the file. |
/api/map/pipelines.json | GeoJSON | Pipeline routes as GeoJSON, simplified for display (roughly two kilometres), not survey resolution. |
/api/chokepoint-exposure.json | JSON | For each maritime chokepoint, the terminals whose cargoes route through it and their capacity. An editorial routing model, not vessel tracking; the caveat is in the file. |
/llms.txt | text | A plain-text map of the site for language models and other machine readers. |
/llms-full.txt | text | Every asset summary in one file. |
/sitemap-index.xml | XML | The sitemap, split by page type. |
Chart images
Every shareable chart is an image at a fixed address, drawn from the same numbers as the page it belongs to. Each carries its attribution line and links back to its page.
| Chart | Page | Files |
|---|---|---|
| Largest LNG export terminals | /rankings/largest-terminals/ | PNG · SVG |
| Countries by LNG export capacity | /rankings/country-capacity/ | PNG · SVG |
| Biggest gas pipeline owners by length | /rankings/pipeline-owners/ | PNG · SVG |
| Countries by gas pipeline length | /rankings/pipeline-country-length/ | PNG · SVG |
| Shipyards by LNG vessels built | /rankings/shipyards/ | PNG · SVG |
| LNG carriers under construction | /rankings/order-book/ | PNG · SVG |
| Operating LNG carriers by delivery year | /rankings/fleet-age/ | PNG · SVG |
| Export capacity under construction | /rankings/construction-timeline/ | PNG · SVG |
| Import capacity under construction | /rankings/construction-timeline/ | PNG · SVG |
| Operating export capacity by start year | /rankings/capacity-by-start-year/ | PNG · SVG |
| Operating import capacity by start year | /rankings/capacity-by-start-year/ | PNG · SVG |
| Costliest LNG terminals | /rankings/project-costs/ | PNG · SVG |
| LNG export capacity cancelled, by year | /rankings/cancelled-and-shelved/ | PNG · SVG |
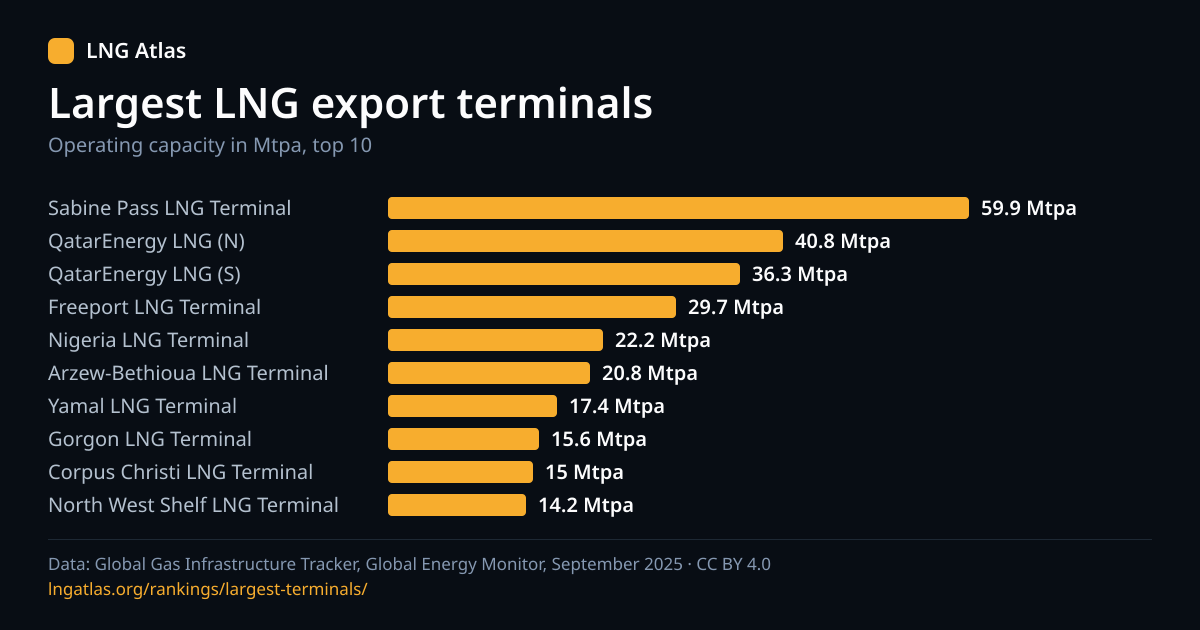
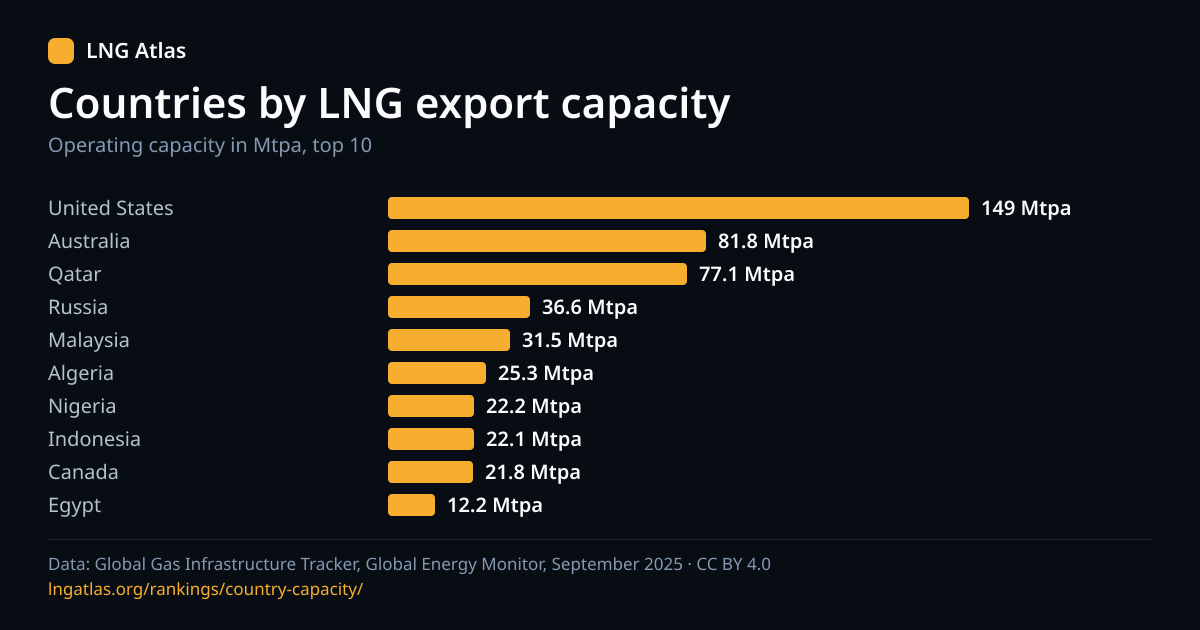
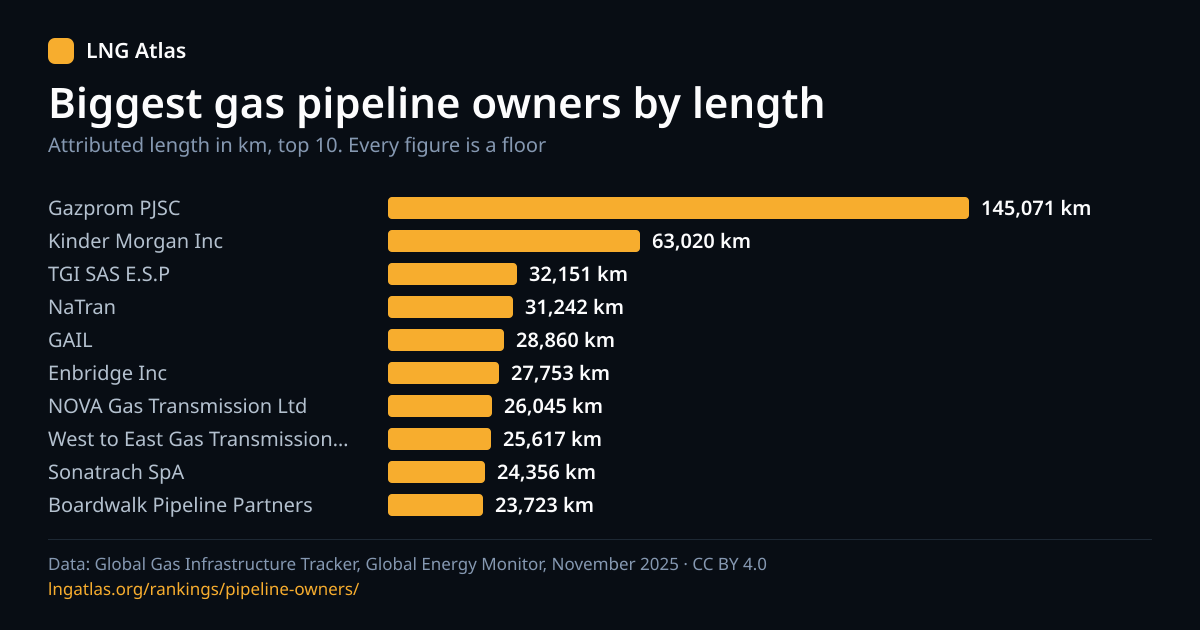
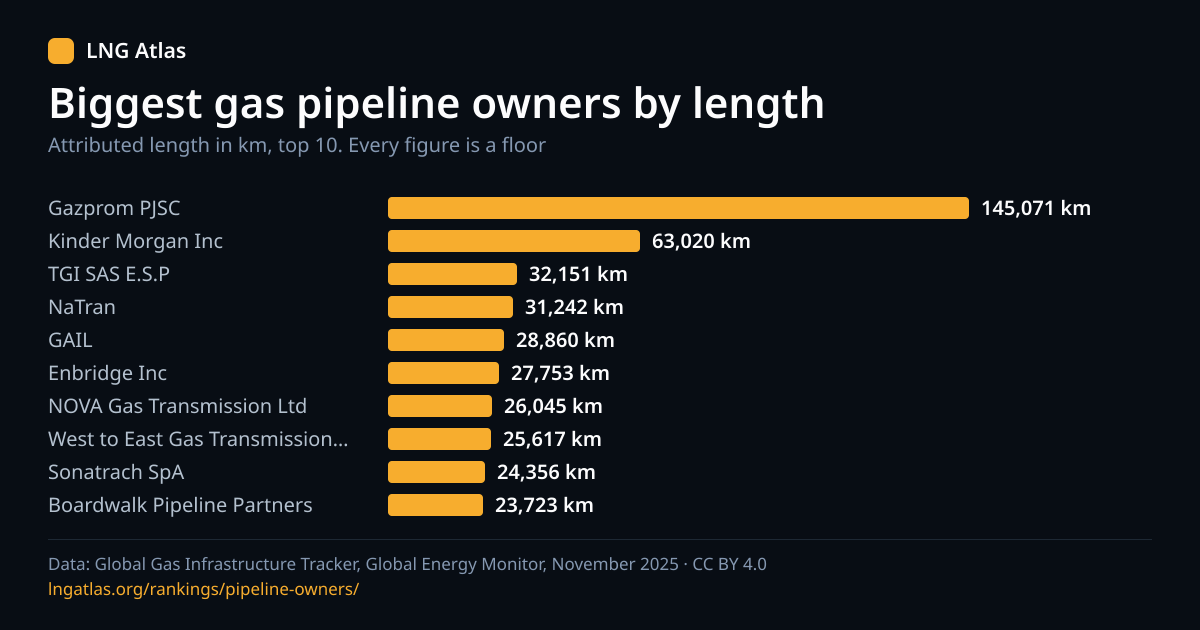
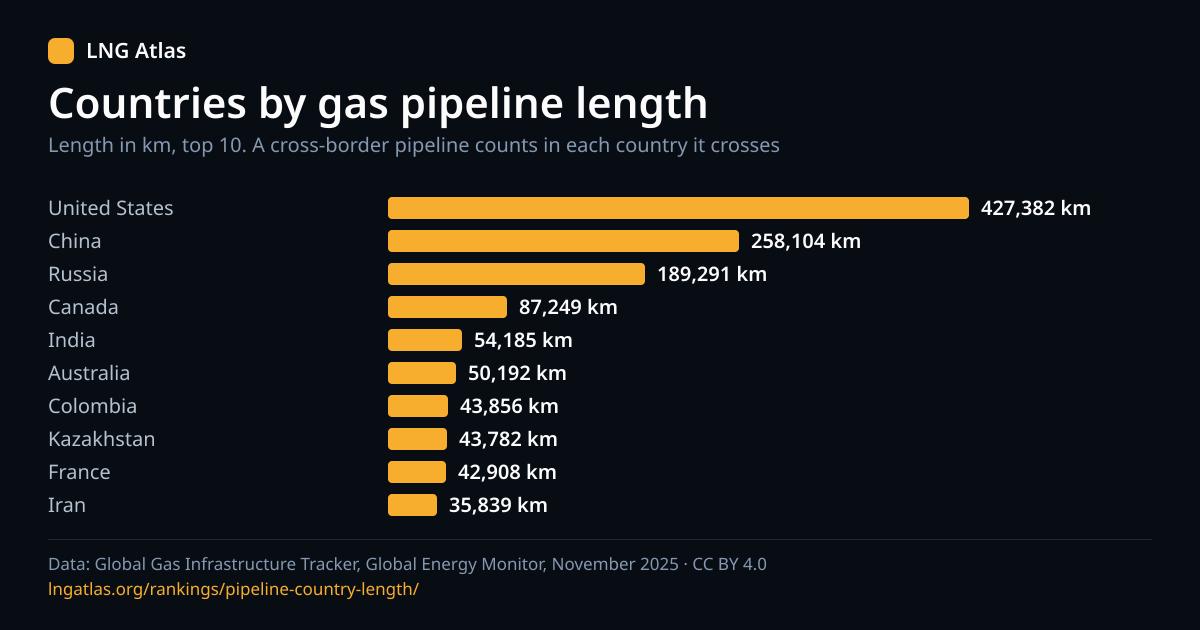
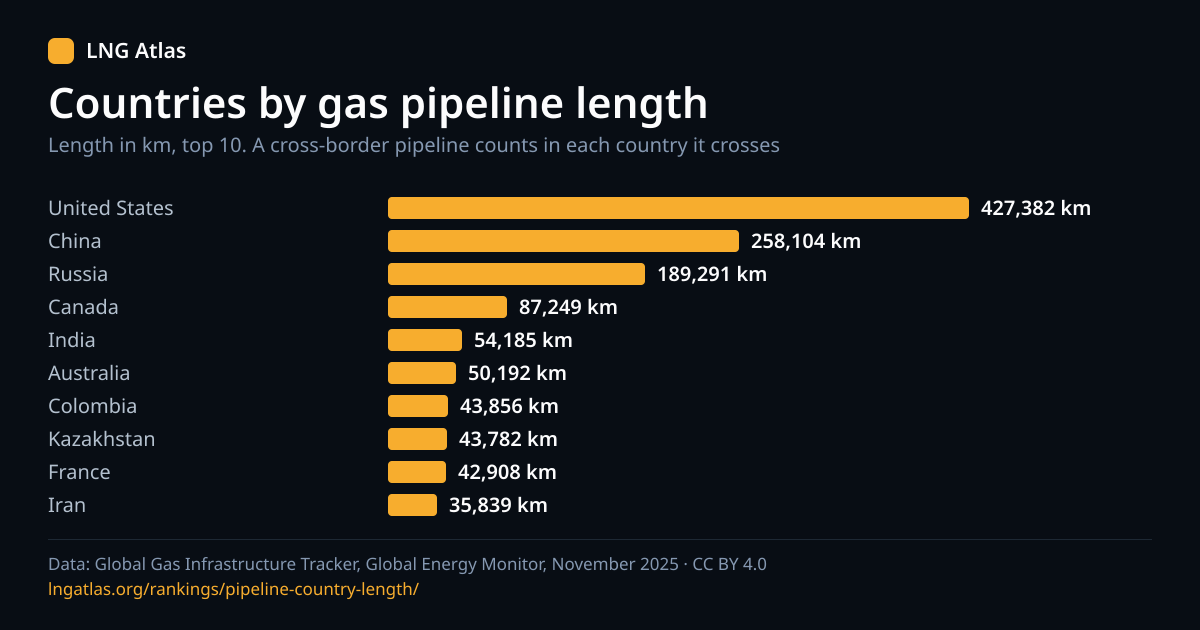
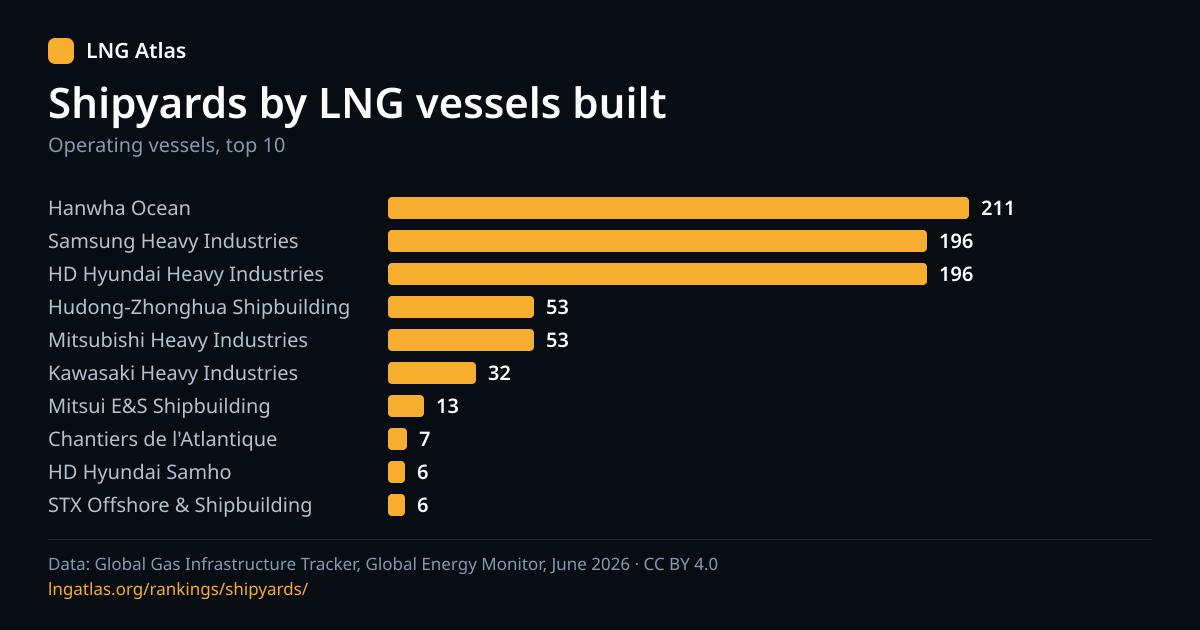
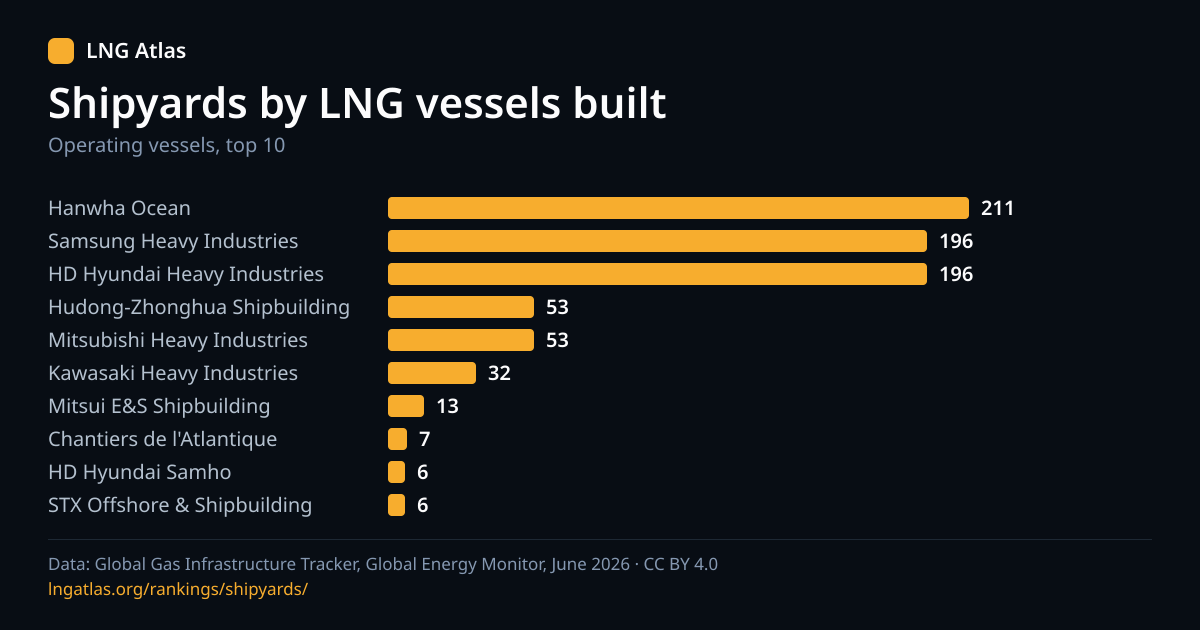
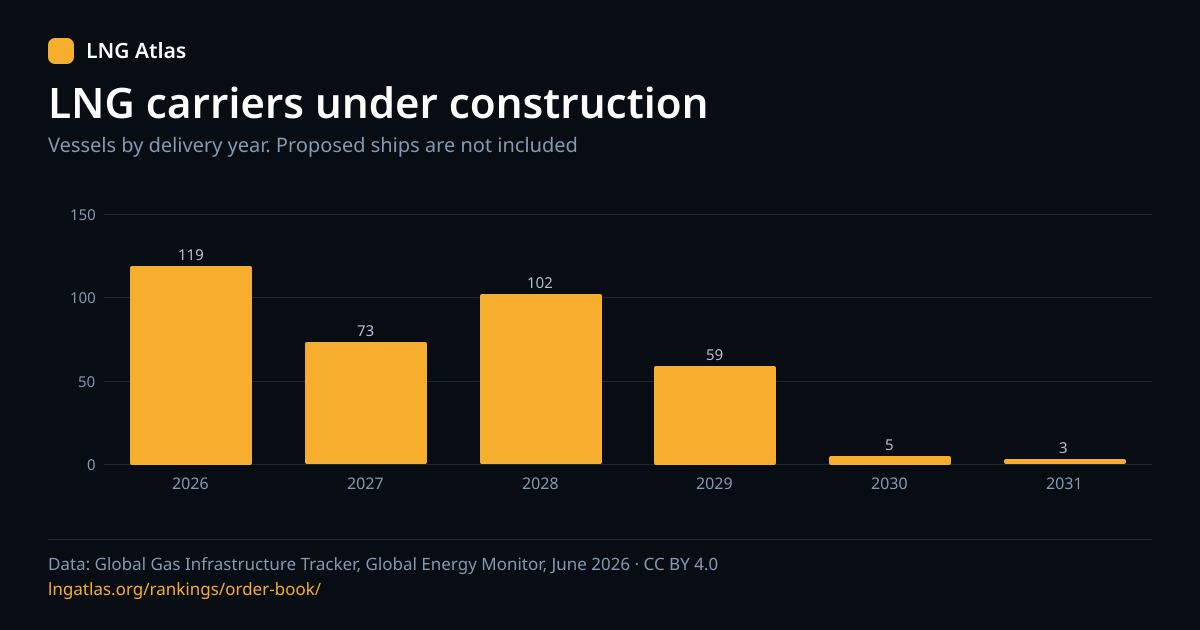
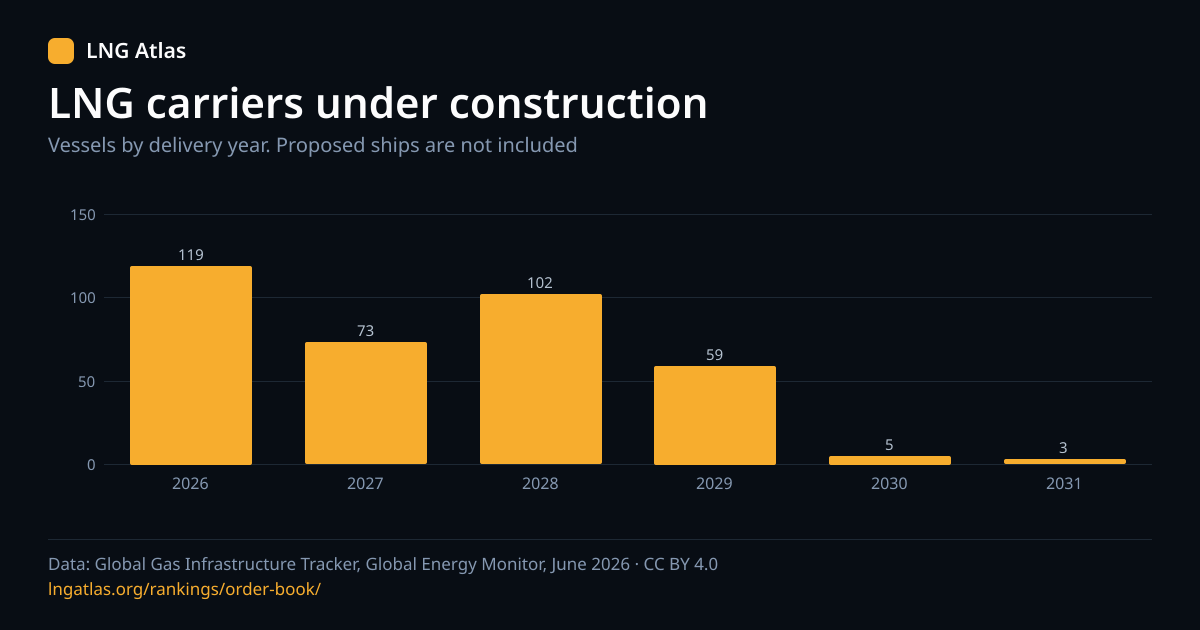
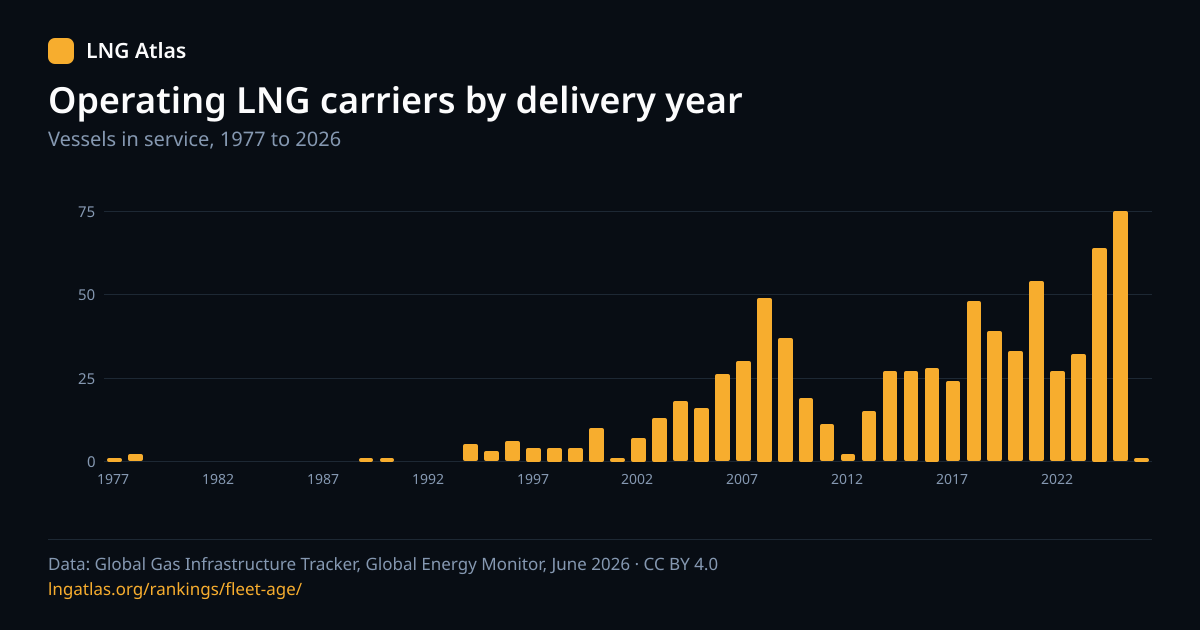
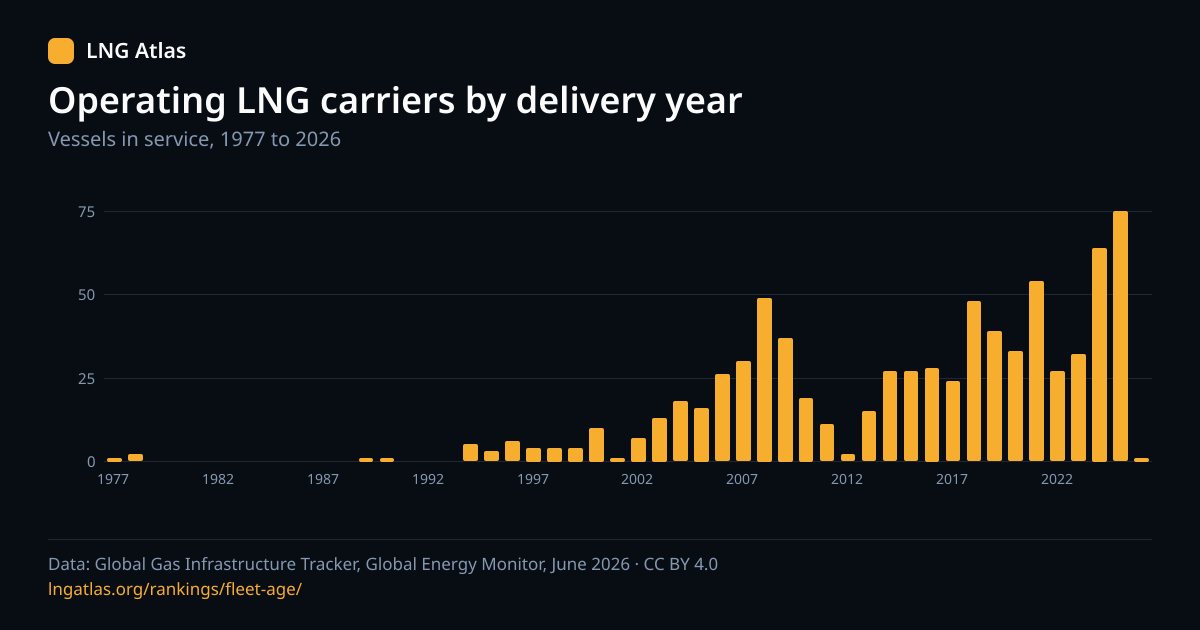
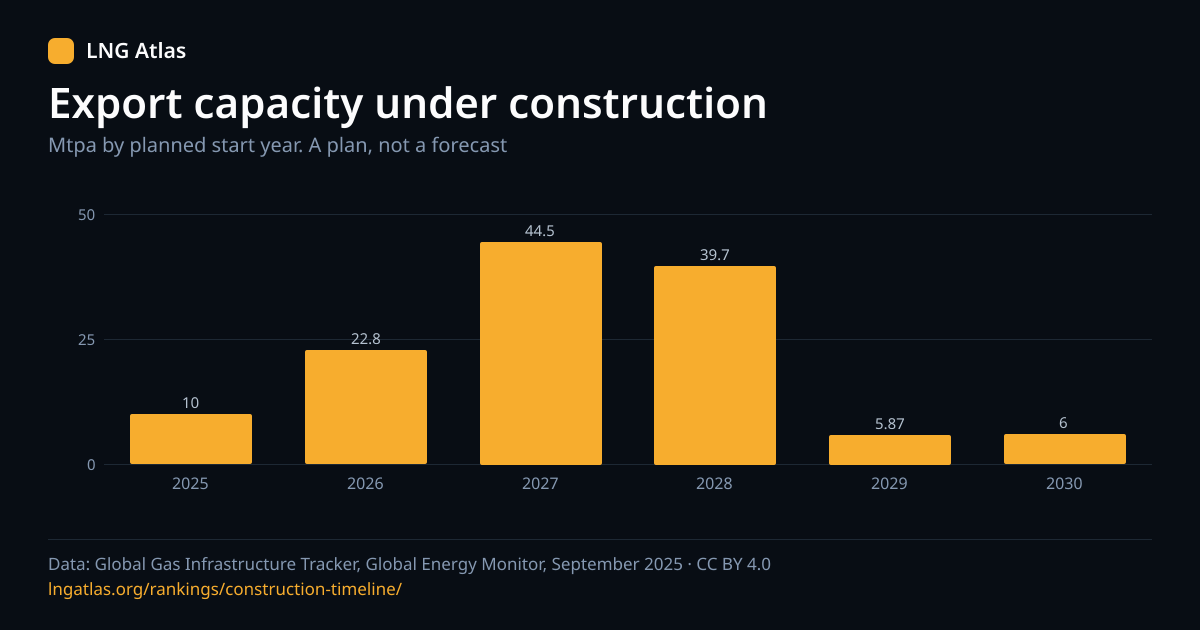
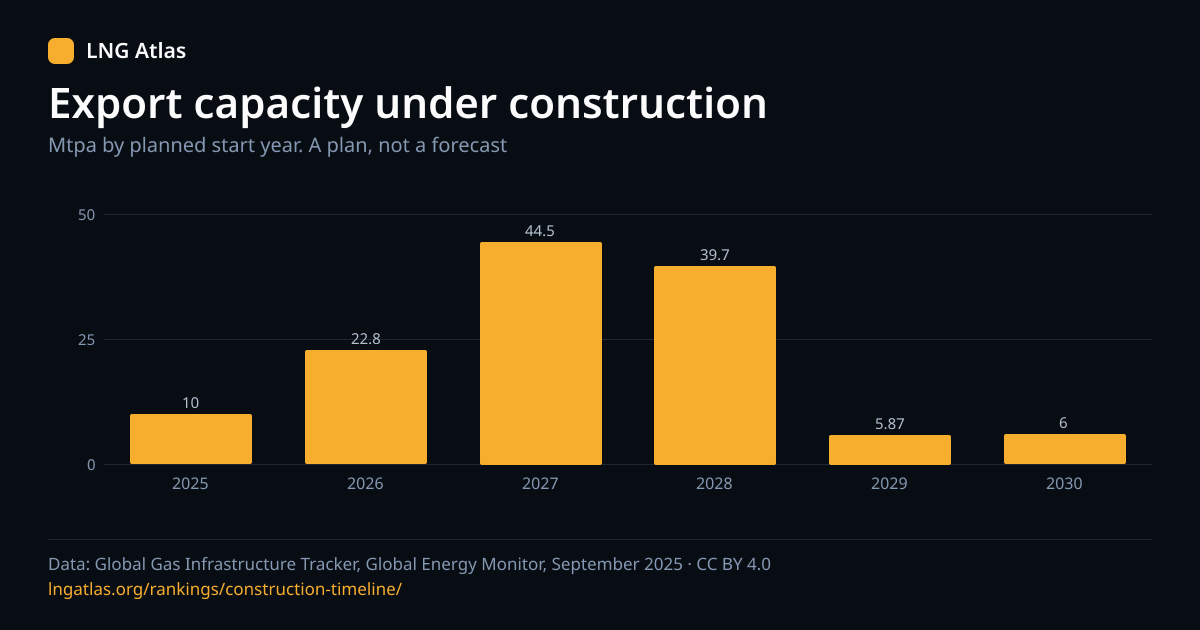
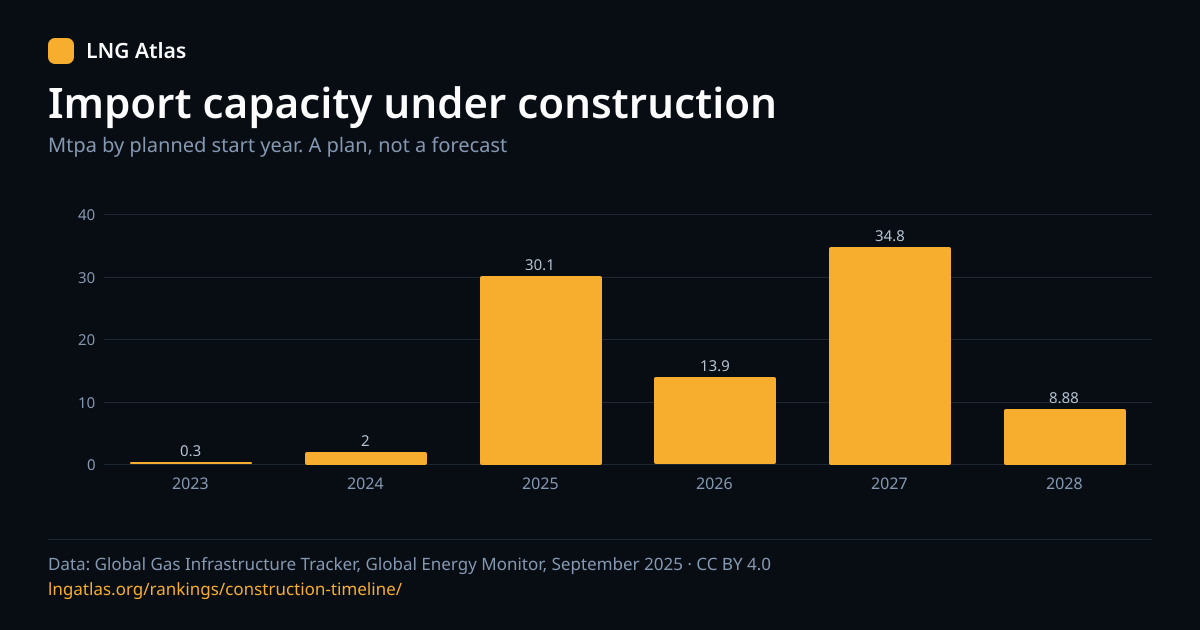
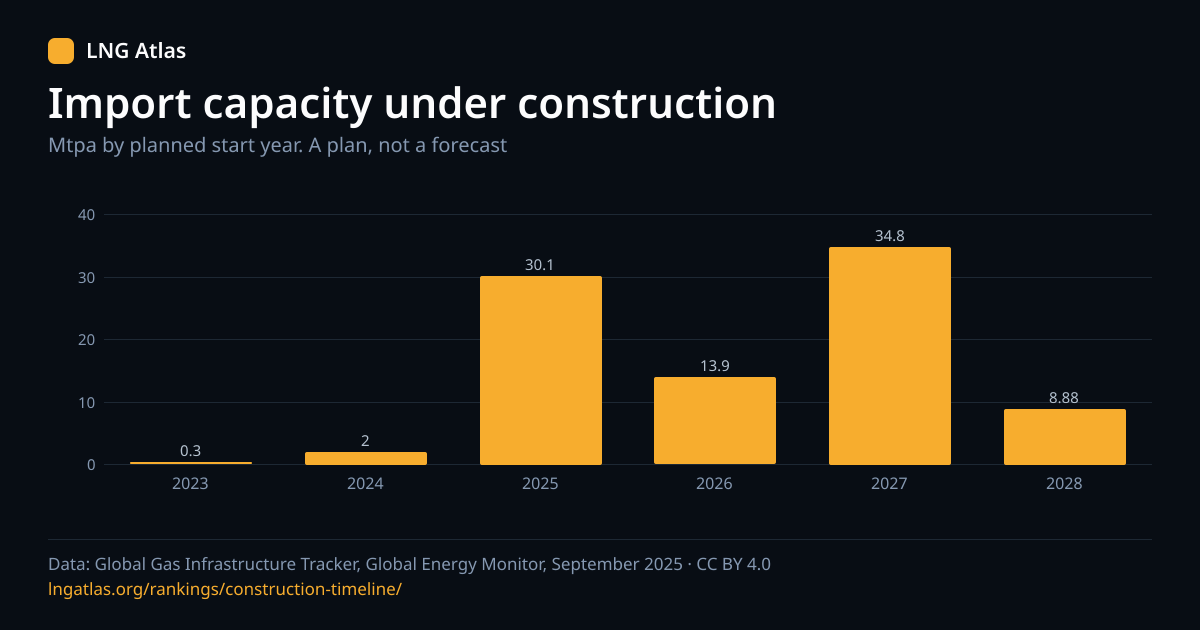
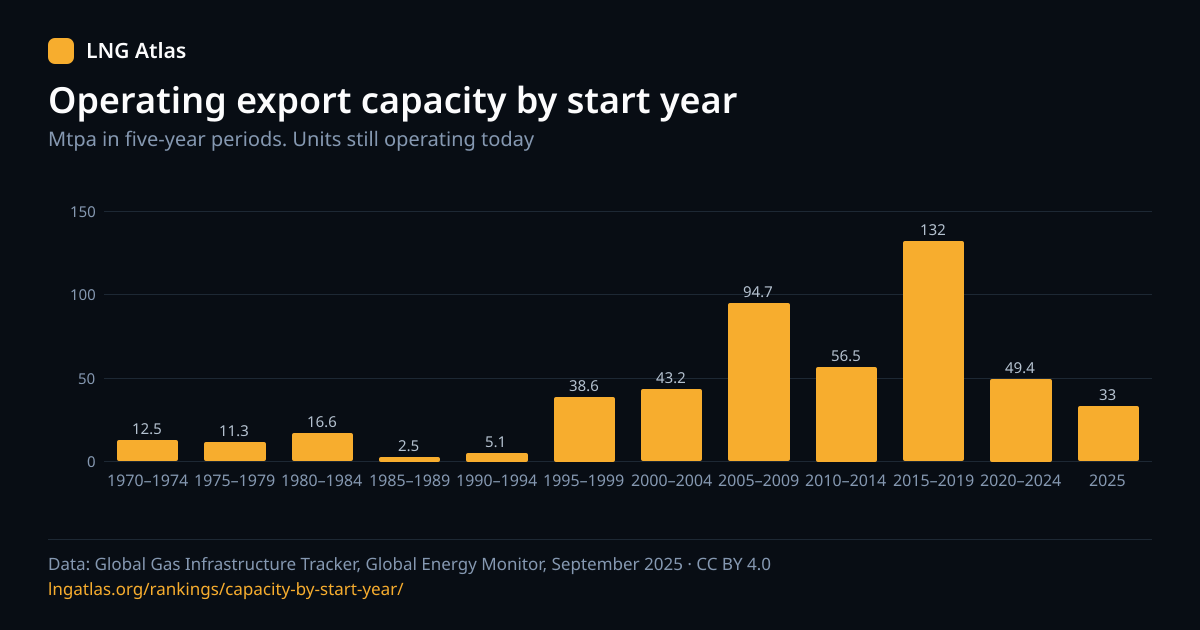
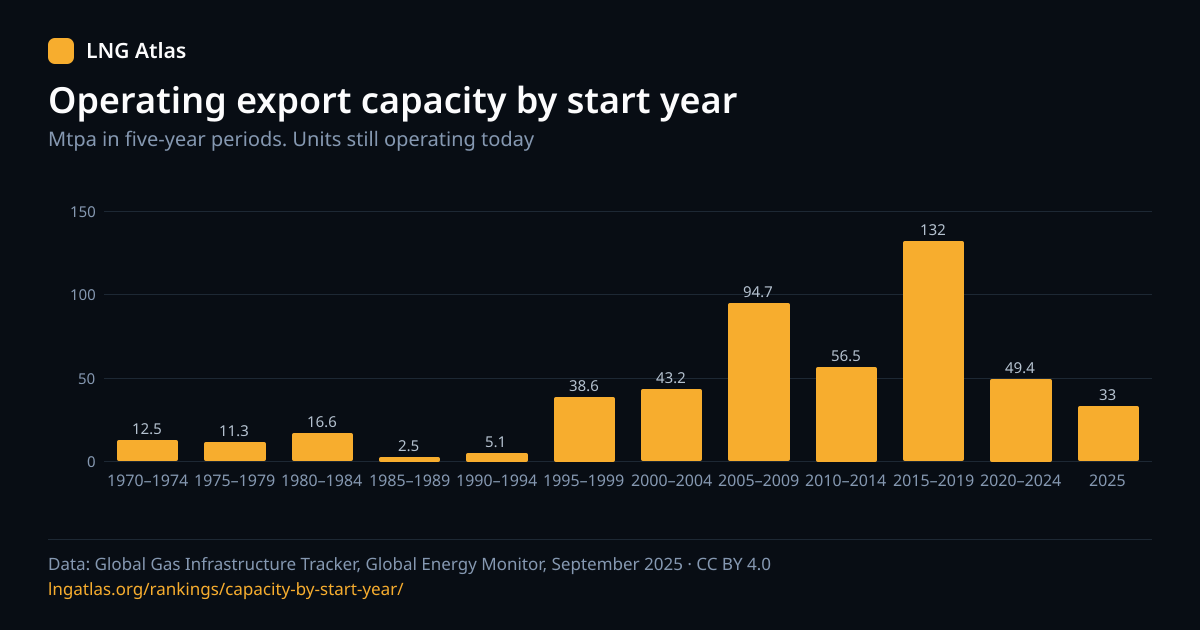
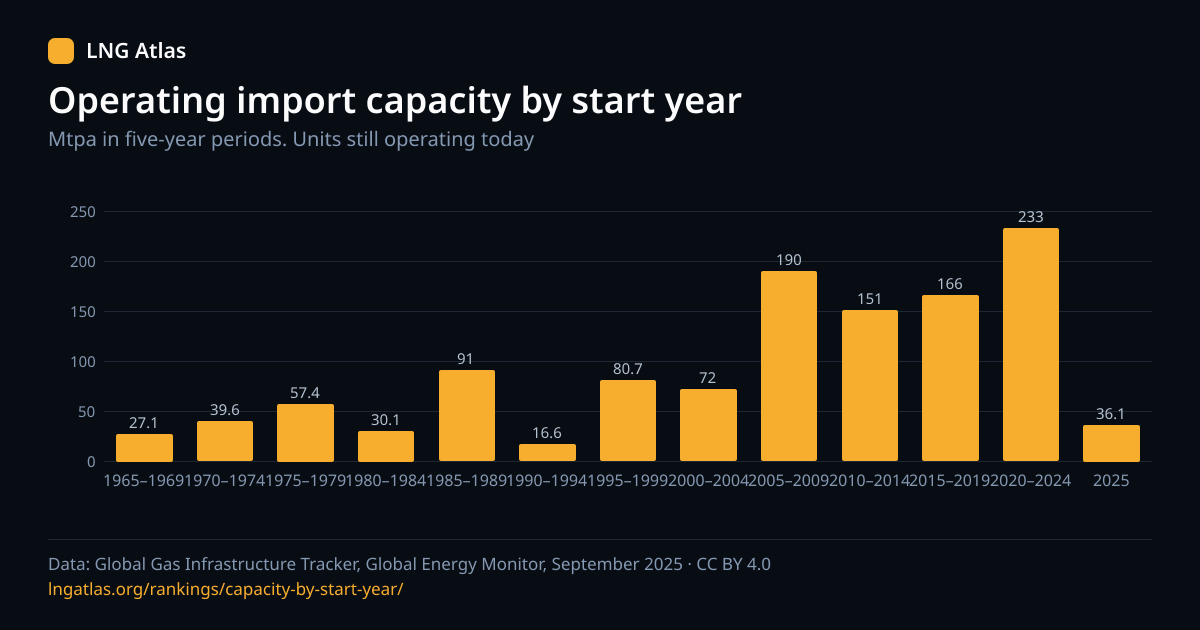
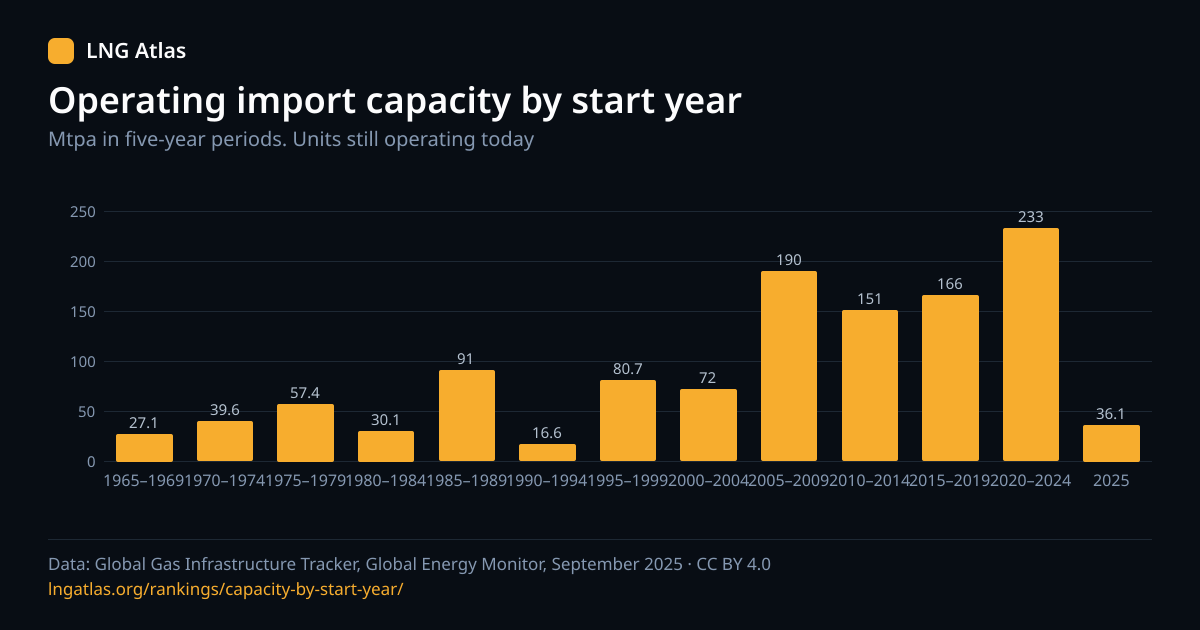
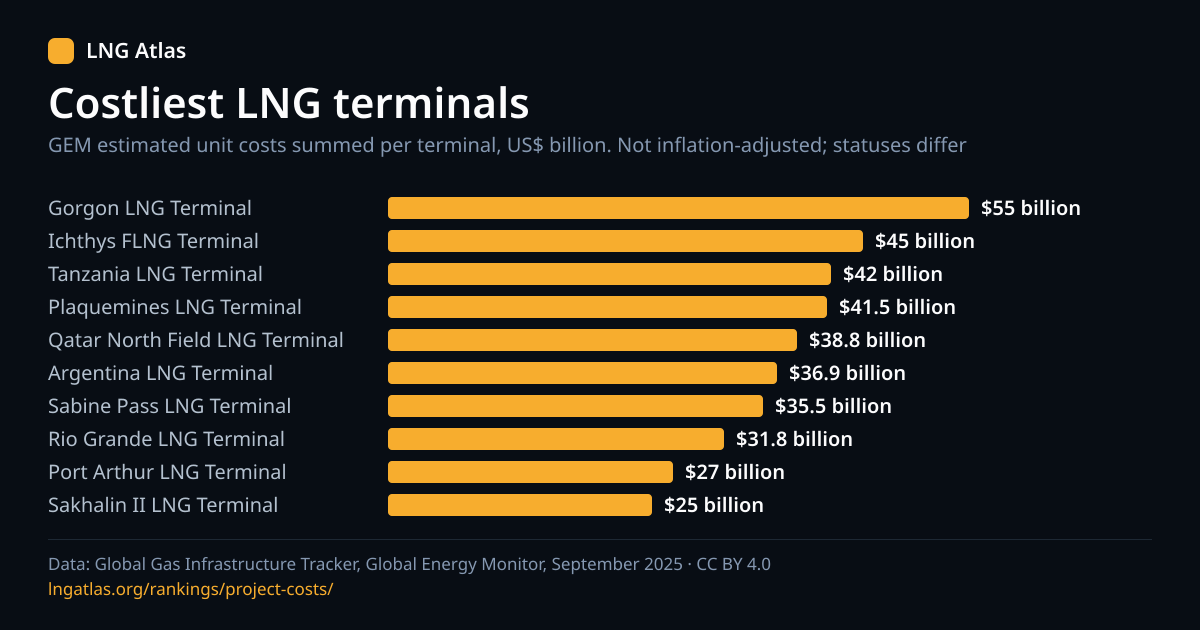
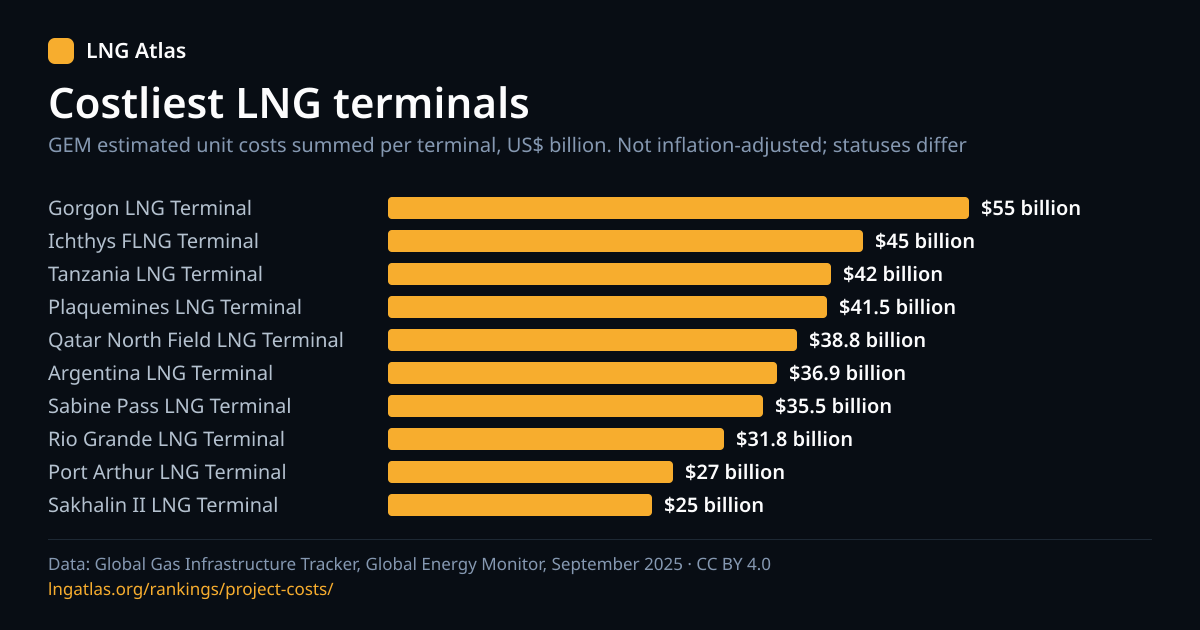
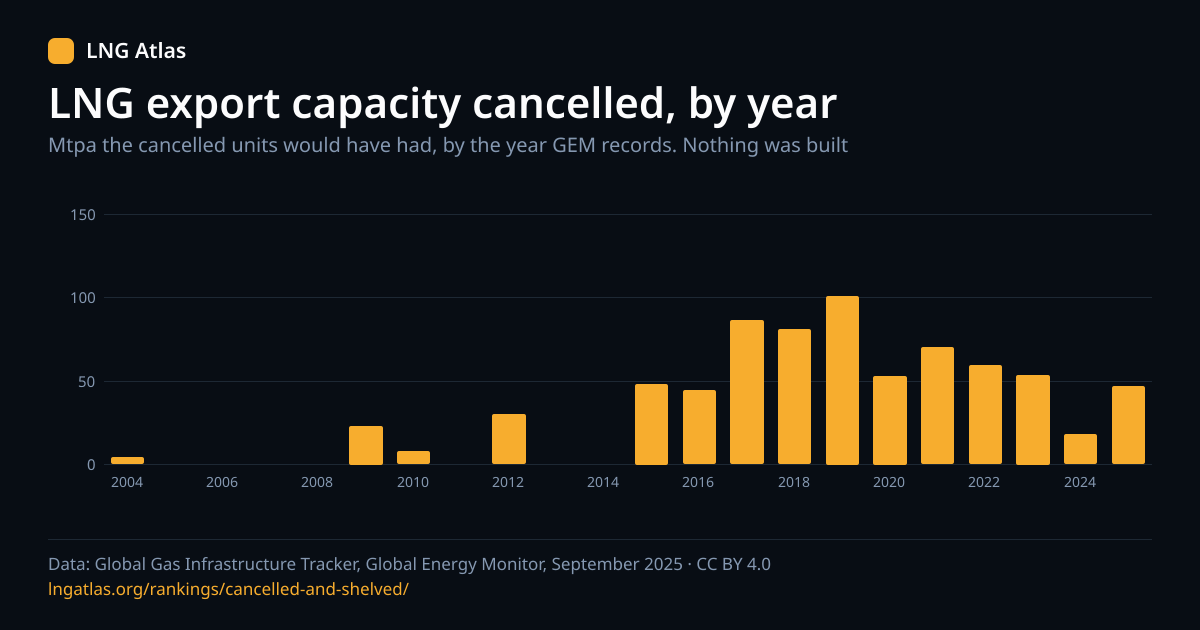
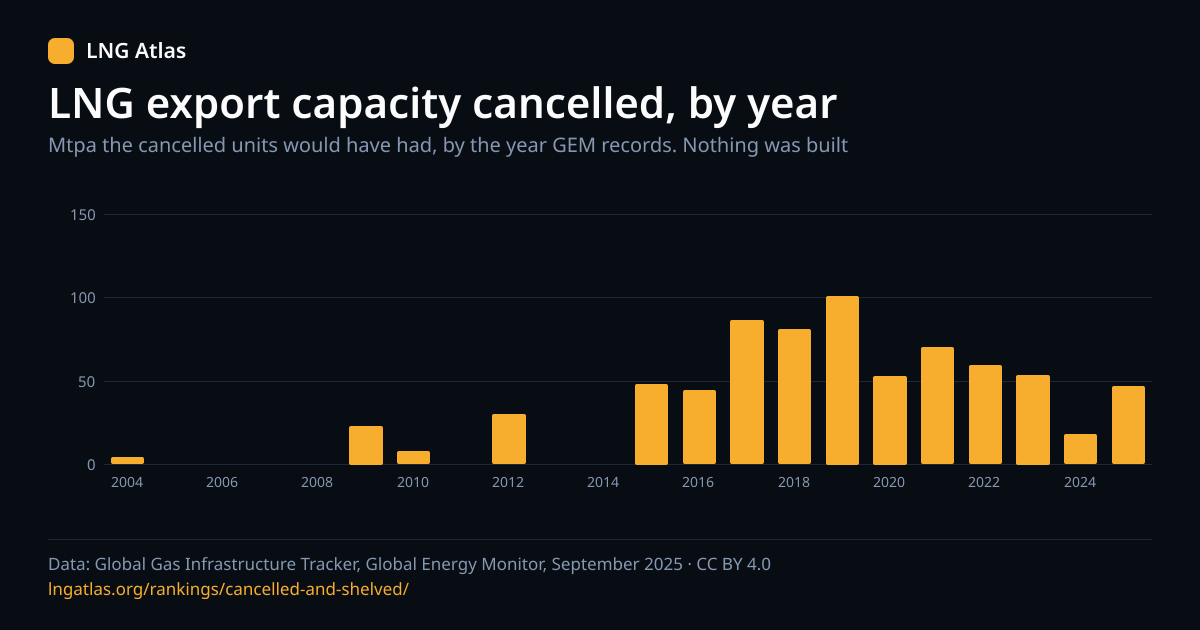
Images are 1200 by 630 pixels; the SVG draws its text as outlines so the file stands alone.
Examples
Command line
curl -O https://lngatlas.org/data/terminals.csvJavaScript in a browser or Node
const res = await fetch('https://lngatlas.org/data/terminals.json');
const { release, attribution, rows } = await res.json();
const operating = rows.filter((r) => r.status === 'operating');
console.log(release, operating.length, attribution);
Python with pandas
import pandas as pd

df = pd.read_csv("https://lngatlas.org/data/terminals.csv")
print(df.groupby("status")["capacity_operating_mtpa"].count())
# Keep the data_source column, or cite it beside any chart you publish.
Do not sum capacity across the operating, construction and proposed columns, and read an empty cell as not reported. Terminal capacity is in million tonnes per year (Mtpa) and bcm/y as separate columns; the conversion used is on the converter.
Reuse, requests and corrections
You may reuse the files, including commercially, with the attribution above. The terms of use cover the rest. If a field you need is missing, or a value looks wrong, write to [email protected] with the page address and the field. A figure that is wrong in the source belongs in Global Energy Monitor's tracker; we can say what the release reports.
Cite this page
Reuse is welcome; please name the page and the tracker release it draws on.