Ranking
Cancelled and shelved LNG capacity and pipelines
What was proposed and never built, by the year Global Energy Monitor records it as cancelled or shelved. Export and import are shown apart, and none of it is operating capacity.
Capacity that was proposed, not capacity that existed
A cancelled or shelved unit counts under its current status, in the year GEM records for that status. The Mtpa is what the unit would have had; nothing was built. Cancelled and shelved are two statuses and are never added together, and neither is added to operating or under-construction capacity.
273 of 301 cancelled units and 88 of 105 shelved units report a year; the rest are left out of the year rows, not guessed. 174 cancelled units were shelved first. A unit with no capacity reported is counted in its year and adds nothing to the total. GEM infers “shelved” after two years without development updates and “cancelled” after four, so a status is often a finding of inactivity, not an announced decision, and the tracker does not say why any project stopped; neither does this page.
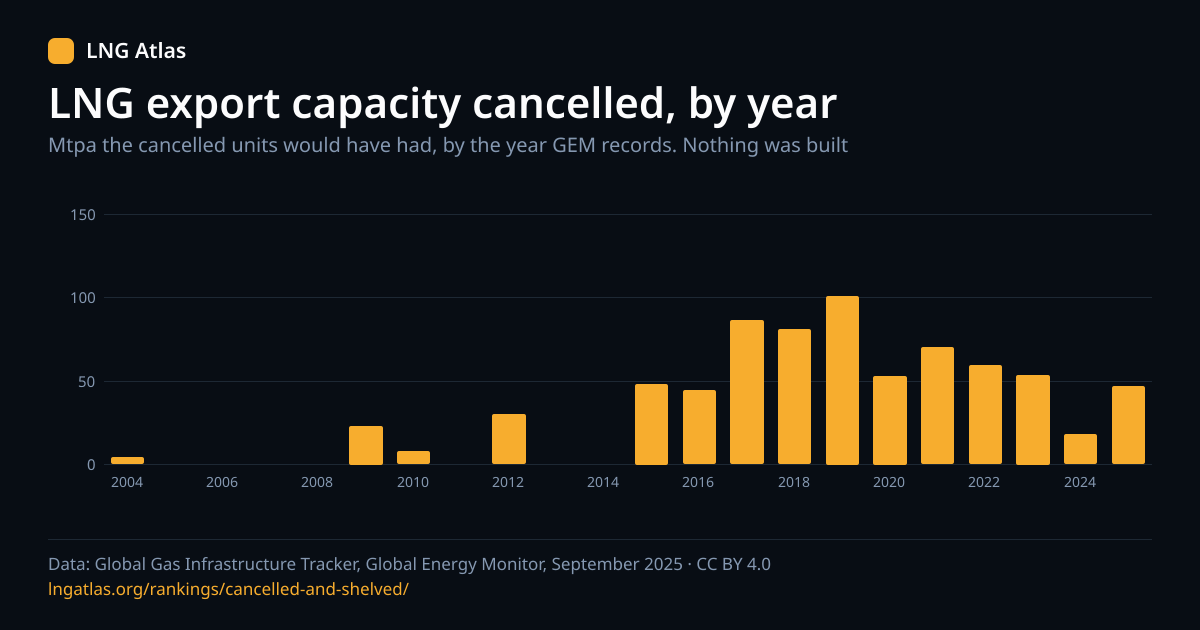
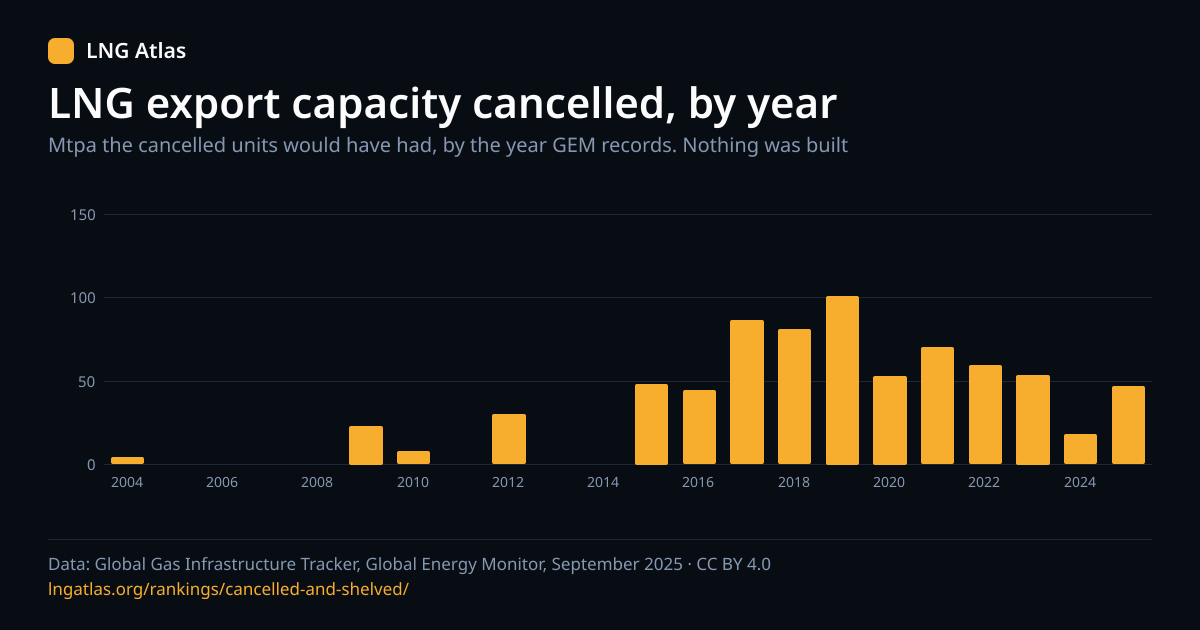
Export capacity cancelled, by year
Liquefaction units now cancelled, in million tonnes per year, by the year GEM records.
Show these figures as a table
| Year | Mtpa |
|---|---|
| 2004 | 4 |
| 2005 | 0 |
| 2006 | 0 |
| 2007 | 0 |
| 2008 | 0 |
| 2009 | 22.9 |
| 2010 | 7.67 |
| 2011 | 0 |
| 2012 | 30 |
| 2013 | 0 |
| 2014 | 0 |
| 2015 | 48.1 |
| 2016 | 44.2 |
| 2017 | 86.3 |
| 2018 | 80.8 |
| 2019 | 101 |
| 2020 | 53 |
| 2021 | 70.1 |
| 2022 | 59.2 |
| 2023 | 53.7 |
| 2024 | 17.8 |
| 2025 | 46.6 |
Use this chart
Embed it on your site
The image links back to this page and carries its data attribution line; please keep both.
Cancelled export (liquefaction) units
Capacity the cancelled units were proposed with, in million tonnes per year, by year cancelled.
| Year | Units | Terminals | Capacity | Units with no capacity reported |
|---|---|---|---|---|
| 2004 | 1 | 1 | 4 Mtpa | — |
| 2009 | 2 | 2 | 22.9 Mtpa | — |
| 2010 | 1 | 1 | 7.67 Mtpa | — |
| 2011 | 1 | 1 | Not reported | 1 |
| 2012 | 1 | 1 | 30 Mtpa | — |
| 2015 | 6 | 5 | 48.1 Mtpa | — |
| 2016 | 6 | 6 | 44.2 Mtpa | — |
| 2017 | 9 | 8 | 86.3 Mtpa | — |
| 2018 | 14 | 11 | 80.8 Mtpa | 1 |
| 2019 | 12 | 12 | 101 Mtpa | 2 |
| 2020 | 9 | 7 | 53 Mtpa | 1 |
| 2021 | 9 | 9 | 70.1 Mtpa | — |
| 2022 | 8 | 8 | 59.2 Mtpa | 1 |
| 2023 | 9 | 7 | 53.7 Mtpa | 1 |
| 2024 | 7 | 6 | 17.8 Mtpa | 1 |
| 2025 | 10 | 7 | 46.6 Mtpa | 2 |
105 units with a year, 725 Mtpa in the years above. Every terminal is in the directory, filterable by status.
Cancelled import (regasification) units
Send-out capacity the cancelled units were proposed with, by year cancelled.
| Year | Units | Terminals | Capacity | Units with no capacity reported |
|---|---|---|---|---|
| 2005 | 1 | 1 | 12 Mtpa | — |
| 2006 | 2 | 2 | 19.5 Mtpa | — |
| 2007 | 3 | 3 | 15.4 Mtpa | — |
| 2008 | 3 | 3 | 21.4 Mtpa | — |
| 2009 | 5 | 5 | 28.7 Mtpa | — |
| 2010 | 4 | 4 | 30.2 Mtpa | 1 |
| 2011 | 5 | 5 | 18.5 Mtpa | 1 |
| 2012 | 5 | 5 | 40.9 Mtpa | 1 |
| 2013 | 4 | 4 | 31.5 Mtpa | — |
| 2014 | 5 | 5 | 29.2 Mtpa | — |
| 2015 | 6 | 6 | 21.4 Mtpa | 1 |
| 2016 | 7 | 7 | 24.5 Mtpa | 2 |
| 2017 | 8 | 8 | 45.4 Mtpa | — |
| 2018 | 13 | 13 | 49.5 Mtpa | 3 |
| 2019 | 9 | 9 | 32.3 Mtpa | 4 |
| 2020 | 4 | 4 | 6 Mtpa | 1 |
| 2021 | 17 | 17 | 62.5 Mtpa | 3 |
| 2022 | 11 | 11 | 30.7 Mtpa | 3 |
| 2023 | 20 | 18 | 42.5 Mtpa | 7 |
| 2024 | 20 | 20 | 31.3 Mtpa | 11 |
| 2025 | 15 | 14 | 18.7 Mtpa | 7 |
167 units with a year, 612 Mtpa in the years above. Every terminal is in the directory, filterable by status.
Shelved export units
Units whose current status is shelved, by year shelved. Shelved is not cancelled: some may return.
| Year | Units | Terminals | Capacity | Units with no capacity reported |
|---|---|---|---|---|
| 2009 | 1 | 1 | 5 Mtpa | — |
| 2019 | 2 | 1 | 10 Mtpa | — |
| 2021 | 4 | 1 | 22.9 Mtpa | — |
| 2023 | 8 | 3 | 1.4 Mtpa | 7 |
| 2024 | 5 | 4 | 8.7 Mtpa | 1 |
| 2025 | 9 | 8 | 34.6 Mtpa | 2 |
29 units with a year, 82.6 Mtpa in the years above. Every terminal is in the directory, filterable by status.
Shelved import units
Units whose current status is shelved, by year shelved.
| Year | Units | Terminals | Capacity | Units with no capacity reported |
|---|---|---|---|---|
| 2020 | 1 | 1 | 0.2 Mtpa | — |
| 2021 | 3 | 3 | 6.5 Mtpa | — |
| 2022 | 4 | 4 | 6.61 Mtpa | 2 |
| 2023 | 8 | 8 | 19.7 Mtpa | 1 |
| 2024 | 17 | 17 | 28.6 Mtpa | 8 |
| 2025 | 26 | 16 | 46.6 Mtpa | 12 |
59 units with a year, 108 Mtpa in the years above. Every terminal is in the directory, filterable by status.
Largest cancelled export units
By the capacity each unit was proposed with. Where GEM reports a cost for the cancelled unit, it is shown as a record of what was planned, not money spent.
| # | Terminal | Unit | Country | Capacity | Cancelled | Estimated cost |
|---|---|---|---|---|---|---|
| 1 | North Pars LNG Terminal | T1-T4 | Iran | 32 Mtpa | 2022 | Not reported |
| 2 | Orca FLNG Terminal | T1-T6 | Canada | 30 Mtpa | 2019 | Not reported |
| 3 | Shtokman LNG Terminal | Not reported | Russia | 30 Mtpa | 2012 | Not reported |
| 4 | WCC LNG Terminal | T1-T6 | Canada | 30 Mtpa | 2018 | Not reported |
| 5 | Kwispaa LNG Terminal | T1-T4 | Canada | 24 Mtpa | 2019 | Not reported |
| 6 | Main Pass Energy Hub FLNG Terminal | T1-T6 | United States | 24 Mtpa | 2021 | $14 billion |
| 7 | Prince Rupert LNG Terminal | T1-T3 | Canada | 21 Mtpa | 2017 | Not reported |
| 8 | Discovery LNG Terminal | T1-T4 | Canada | 20 Mtpa | 2019 | Not reported |
| 9 | Kitsault LNG Terminal | T1-T4 | Canada | 20 Mtpa | 2009 | Not reported |
| 10 | Arrow Energy LNG Terminal | T1-T4 | Australia | 18 Mtpa | 2015 | $10.9 billion |
Cancelled and shelved gas pipelines
By the year GEM records for each status. A pipeline’s length is GEM’s merged figure; a pipeline with no length reported is counted and adds nothing to the kilometres.
Cancelled
| Year | Pipelines | Length |
|---|---|---|
| 2005 | 1 | 940 km |
| 2006 | 1 | 200 km |
| 2007 | 1 | 3,800 km |
| 2008 | 1 | 275 km |
| 2009 | 2 | 3,553 km |
| 2010 | 2 | 2,196 km |
| 2011 | 3 | 2,125 km |
| 2012 | 3 | 320 km |
| 2013 | 5 | 4,688 km |
| 2014 | 4 | 5,779 km |
| 2015 | 3 | 743 km |
| 2016 | 7 | 4,642 km |
| 2017 | 7 | 2,690 km |
| 2018 | 7 | 3,475 km |
| 2019 | 5 | 2,464 km |
| 2020 | 22 | 9,892 km |
| 2021 | 13 | 3,232 km |
| 2022 | 18 | 4,989 km |
| 2023 | 12 | 2,830 km |
| 2024 | 13 | 3,004 km |
| 2025 | 16 | 4,744 km |
146 of 243 cancelled pipelines report a year.
Shelved
| Year | Pipelines | Length |
|---|---|---|
| 2015 | 1 | 17 km |
| 2019 | 1 | 72 km |
| 2020 | 2 | 906 km |
| 2021 | 3 | 1,881 km |
| 2022 | 2 | 605 km |
| 2024 | 7 | 3,366 km |
| 2025 | 5 | 1,414 km |
21 of 103 shelved pipelines report a year.
The same two-year and four-year inference applies to pipelines, so a cancellation year is not always the date of a decision. Pipelines are in the directory.
Common questions
Each answer stands on its own.
- How much LNG export capacity has been cancelled?
- 725 Mtpa across 105 export units that GEM records as cancelled with a year, from 2004 to 2025. That is the capacity the units were proposed with; none of it was built. 28 cancelled units report no year and are not in that figure.
- When were most LNG export projects cancelled?
- The largest single year in the data is 2019, with 101 Mtpa across 12 units. Since 2020 the cancelled export units total 300 Mtpa. The tracker does not say why any project was cancelled, so no cause is given here.
- What is the difference between cancelled and shelved?
- They are two statuses in the tracker. GEM infers shelved when a project has had no development updates for two years and cancelled when it has had none for four, so a status is often a judgement about inactivity, not an announced decision. Many cancelled units were shelved first, which is why a unit can carry both years. This page counts a unit by its current status, and the two are never added together.
- Does cancelled capacity count towards how much LNG capacity exists?
- No. Cancelled and shelved capacity was proposed and never built, so it is never added to operating, under-construction or proposed capacity anywhere on this site.
- Is a cancelled project one that its sponsors formally abandoned?
- Not necessarily. GEM's notes say a project with no development updates for four years is inferred to be cancelled, as well as ones formally cancelled, and the workbooks do not mark which is which. A cancellation year can therefore be when GEM concluded a project had stopped, not when a decision was announced. 97 of 243 cancelled pipelines also report no year at all.
Cite this page
Reuse is welcome; please name the page and the tracker release it draws on.