Ranking
What LNG terminals and gas pipelines are estimated to cost
Estimated cost per tonne a year of LNG capacity, and gas pipeline project costs, by status, from the cost fields Global Energy Monitor reports. Estimates in US dollars, not adjusted for inflation.
Read these as estimates, one status at a time
Each cost is Global Energy Monitor’s estimate for one unit or project, in its own currency, converted to US dollars by GEM and recorded when that entry was last updated. They are not adjusted for inflation, and they mix reported and estimated figures and different scopes, so a unit built in 2010 and one proposed for 2030 are not like for like.
437 of 1,206 terminal units report a cost, and 414 also report a capacity, the only ones a cost per tonne can be taken from. A unit with no cost is left out, never counted as zero. Operating, under-construction and proposed units are shown apart and never added together, and export and import are never added either.
Export (liquefaction)
Liquefaction trains and phases: estimated cost for each unit that reports one, divided by the capacity of those same units.
| Status | Units | With a cost | With cost and capacity | Per tonne a year (summed) | Per tonne a year (median unit) |
|---|---|---|---|---|---|
| Operating | 127 | 76 | 76 | $1,316 | $800 |
| Under construction | 32 | 25 | 25 | $960 | $1,000 |
| Proposed | 125 | 46 | 43 | $1,192 | $983 |
Summed is the total cost of the units with both figures divided by their total capacity, so large units weigh more; the median is the middle unit’s own ratio, which one very large or very small unit cannot move. Units are in the terminal directory.
Import (regasification), all
Regasification units, FSRUs included.
| Status | Units | With a cost | With cost and capacity | Per tonne a year (summed) | Per tonne a year (median unit) |
|---|---|---|---|---|---|
| Operating | 247 | 88 | 87 | $199 | $192 |
| Under construction | 57 | 38 | 35 | $256 | $255 |
| Proposed | 155 | 46 | 40 | $179 | $147 |
Summed is the total cost of the units with both figures divided by their total capacity, so large units weigh more; the median is the middle unit’s own ratio, which one very large or very small unit cannot move. Units are in the terminal directory.
Floating and not floating import units
The same import figures split by whether the unit is tagged as an FSRU, FLNG or other floating unit.
| Group | Status | With cost and capacity | Per tonne a year (summed) | Per tonne a year (median unit) |
|---|---|---|---|---|
| Import, tagged FSRU or floating | Operating | 15 | $123 | $133 |
| Import, tagged FSRU or floating | Under construction | 5 | $252 | $295 |
| Import, tagged FSRU or floating | Proposed | 14 | $109 | $118 |
| Import, not tagged floating | Operating | 72 | $218 | $216 |
| Import, not tagged floating | Under construction | 30 | $256 | $241 |
| Import, not tagged floating | Proposed | 26 | $200 | $162 |
“Not tagged floating” is every import unit not marked FSRU, FLNG or floating. It is almost certainly onshore, but that is an inference from an absent tag, not a count GEM confirms. The figures say what the tracker reports, not why the two groups differ; for the engineering trade-offs see FSRU vs onshore regasification and the comparison.
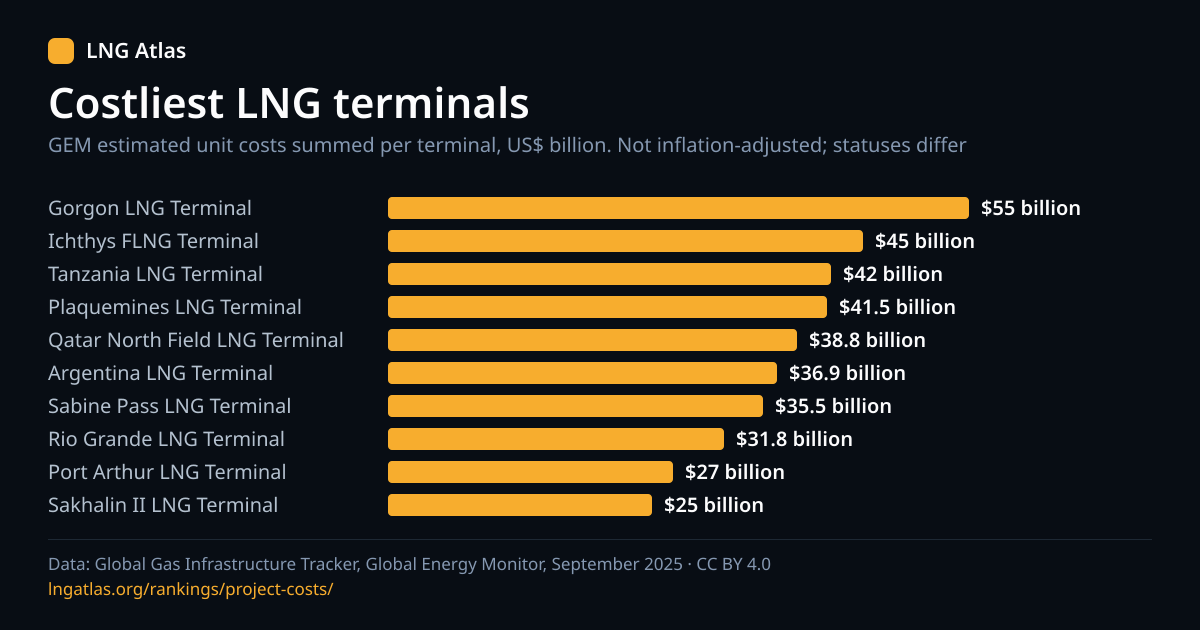
Terminals with the largest estimated cost
Each terminal’s units that report a cost, summed. Terminals are at different stages, so each row carries its status, and the figure is not a total across them.
- Gorgon LNG Terminal$55 billion
- Ichthys FLNG Terminal$45 billion
- Tanzania LNG Terminal$42 billion
- Plaquemines LNG Terminal$41.5 billion
- Qatar North Field LNG Terminal$38.8 billion
- Argentina LNG Terminal$36.9 billion
- Sabine Pass LNG Terminal$35.5 billion
- Rio Grande LNG Terminal$31.8 billion
- Port Arthur LNG Terminal$27 billion
- Sakhalin II LNG Terminal$25 billion
Use this chart
Embed it on your site
The image links back to this page and carries its data attribution line; please keep both.
| # | Terminal | Country | Status | Estimated cost | Units with a cost |
|---|---|---|---|---|---|
| 1 | Gorgon LNG Terminal | Australia | Operating | $55 billion | 3 of 4 |
| 2 | Ichthys FLNG Terminal | Australia | Operating | $45 billion | 2 of 3 |
| 3 | Tanzania LNG Terminal | Tanzania | Proposed | $42 billion | 2 of 2 |
| 4 | Plaquemines LNG Terminal | United States | Operating | $41.5 billion | 3 of 3 |
| 5 | Qatar North Field LNG Terminal | Qatar | Under construction | $38.8 billion | 2 of 3 |
| 6 | Argentina LNG Terminal | Argentina | Proposed | $36.9 billion | 3 of 4 |
| 7 | Sabine Pass LNG Terminal | United States | Operating | $35.5 billion | 7 of 8 |
| 8 | Rio Grande LNG Terminal | United States | Under construction | $31.8 billion | 5 of 7 |
| 9 | Port Arthur LNG Terminal | United States | Under construction | $27 billion | 4 of 4 |
| 10 | Sakhalin II LNG Terminal | Russia | Operating | $25 billion | 2 of 3 |
| 11 | Arctic LNG 2 Terminal | Russia | Operating | $25 billion | 3 of 3 |
| 12 | Corpus Christi LNG Terminal | United States | Operating | $23.5 billion | 4 of 6 |
| 13 | Rovuma LNG Terminal | Mozambique | Proposed | $22 billion | 1 of 1 |
| 14 | Browse FLNG Terminal | Australia | Proposed | $20.5 billion | 2 of 2 |
| 15 | Abadi LNG Terminal | Indonesia | Proposed | $20 billion | 1 of 1 |
Gas pipelines
Project-level cost estimates. Same rules: one status at a time, no totals across them. There is no cost per kilometre here, because a pipeline's cost often covers more or less than the length listed against it.
| Status | Pipelines | With a cost | Median estimated cost |
|---|---|---|---|
| Operating | 2,975 | 742 | $99.9 million |
| Under construction | 282 | 150 | $129 million |
| Proposed | 611 | 295 | $128 million |
Largest estimated project costs
| Pipeline | Status | Length | Estimated cost |
|---|---|---|---|
| Power of Siberia Gas Pipeline | Operating | 2,200 km | $55 billion |
| Nigeria-Morocco Gas Pipeline | Proposed | 5,660 km | $25 billion |
| Sakhalin-Khabarovsk-Vladivostok Gas Pipeline | Operating | 1,822 km | $24 billion |
| West-East Gas Pipeline 1 | Operating | 4,000 km | $22.4 billion |
| Bovanenkovo-Ukhta Gas Pipeline | Operating | 1,200 km | $20 billion |
| Bovanenkovo-Ukhta Gas Pipeline | Operating | 1,200 km | $20 billion |
| West-East Gas Pipeline 3 | Operating | 7,378 km | $20 billion |
| Sierra Madre Gas Pipeline | Proposed | 800 km | $14 billion |
| Scarborough Gas Pipeline | Proposed | 433 km | $12 billion |
| Coastal GasLink Pipeline | Operating | 670 km | $11.6 billion |
A cost can cover more than the pipeline’s listed length (a terminal connection or an offshore section, say), so read the length column as GEM’s figure for the pipeline, not necessarily the scope of the cost. See data coverage for how many pipelines report each field.
Common questions
Each answer stands on its own.
- How much does an LNG export terminal cost per tonne of capacity?
- Across the 76 operating export units that report both a cost and a capacity, the summed estimate works out to $1,316 per tonne a year, and the middle unit's own figure is $800. For the 25 units under construction it is $960 (median $1,000). These are Global Energy Monitor's estimates, converted to US dollars and not adjusted for inflation, so units built in different decades are not like for like.
- Are FSRUs cheaper than onshore regasification terminals?
- Among operating import units that report a cost and a capacity, the 15 tagged as floating work out to $123 per tonne a year and the 72 not tagged floating to $218. The second group is every import unit not tagged as floating, which is almost certainly onshore but is inferred from an absent tag, and the figures do not say why they differ.
- Where do these costs come from, and can I trust them?
- They are the cost fields in Global Energy Monitor's Global Gas Infrastructure Tracker (September 2025). Each is an estimate recorded at the date GEM last updated that entry, in the project's own currency, which GEM then converts to US dollars. Treat them as order-of-magnitude figures: they mix estimated and reported costs, different years and different scopes.
- Why is there no total cost of the LNG industry here?
- A total would add estimates made in different years and currencies across projects that are operating, being built and only proposed. That figure would describe nothing real, so each status is shown on its own, and a unit with no cost reported adds nothing instead of counting as zero.
- How many projects report a cost at all?
- 437 of 1,206 terminal units report an estimated cost and 1,323 of 4,246 pipelines do. The rest are not estimated here; they simply have no cost in the source. The data coverage page counts every field the same way.
Cite this page
Reuse is welcome; please name the page and the tracker release it draws on.