Ranking
LNG final investment decisions, by year
When LNG units reached the decision to build, when others plan to, how long a decision took to become a plant, and where decided units stand now. Units, not capacity; export and import apart.
Only 207 of 1,206 units say anything about FID
GEM records a final investment decision for 94 units and a plan to reach one for 113 more. For the other 999 the field is blank, which GEM defines as no information on FID. A blank is not a “no”, and it is the usual state of an older operating unit, so this page describes the units that report, not every unit. The year is the actual year of the decision for FID units and the planned year for pre-FID units, so the two are in separate tables.
A unit is one train or phase. Nothing here adds capacity: the capacity of any unit is on its terminal page, and capacity at different statuses is never combined.
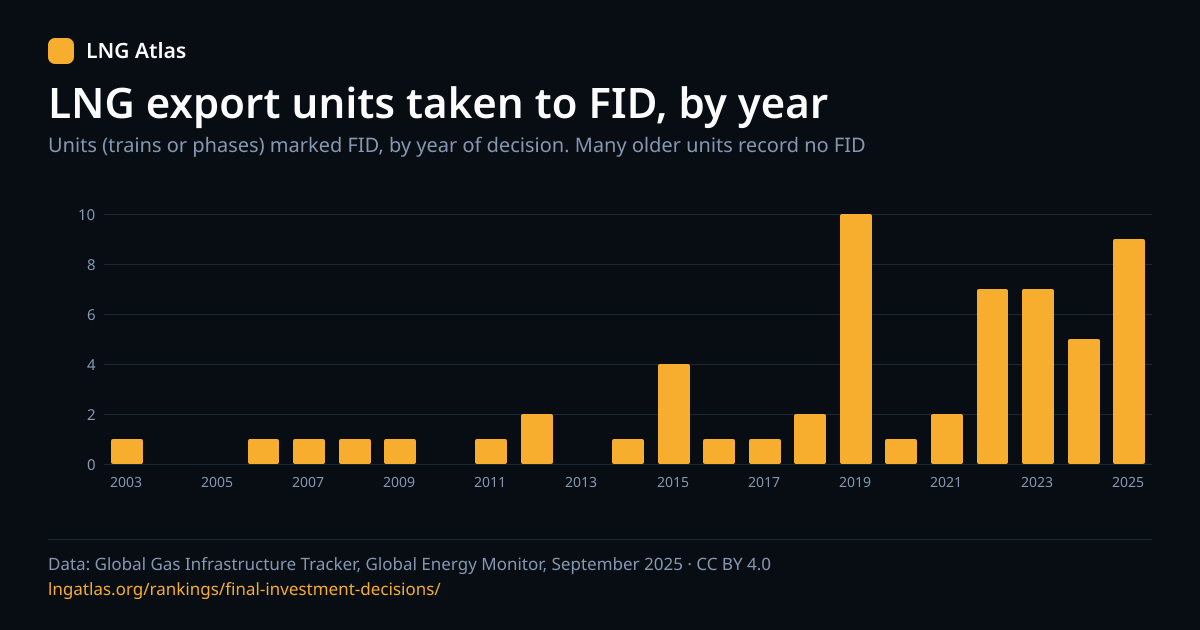
Decisions taken, by year
Units marked FID, by the year GEM gives for the decision. 7 more are marked FID with no year and are not in the table.
Show these figures as a table
| Year | Export units |
|---|---|
| 2003 | 1 |
| 2004 | 0 |
| 2005 | 0 |
| 2006 | 1 |
| 2007 | 1 |
| 2008 | 1 |
| 2009 | 1 |
| 2010 | 0 |
| 2011 | 1 |
| 2012 | 2 |
| 2013 | 0 |
| 2014 | 1 |
| 2015 | 4 |
| 2016 | 1 |
| 2017 | 1 |
| 2018 | 2 |
| 2019 | 10 |
| 2020 | 1 |
| 2021 | 2 |
| 2022 | 7 |
| 2023 | 7 |
| 2024 | 5 |
| 2025 | 9 |
Use this chart
Embed it on your site
The image links back to this page and carries its data attribution line; please keep both.
| FID year | Export units | Import units | Other or unclassified | All units |
|---|---|---|---|---|
| 2003 | 1 | 0 | 0 | 1 |
| 2006 | 1 | 0 | 0 | 1 |
| 2007 | 1 | 1 | 0 | 2 |
| 2008 | 1 | 2 | 0 | 3 |
| 2009 | 1 | 0 | 0 | 1 |
| 2011 | 1 | 1 | 0 | 2 |
| 2012 | 2 | 1 | 0 | 3 |
| 2014 | 1 | 2 | 0 | 3 |
| 2015 | 4 | 0 | 0 | 4 |
| 2016 | 1 | 0 | 0 | 1 |
| 2017 | 1 | 0 | 0 | 1 |
| 2018 | 2 | 1 | 0 | 3 |
| 2019 | 10 | 1 | 0 | 11 |
| 2020 | 1 | 0 | 0 | 1 |
| 2021 | 2 | 8 | 0 | 10 |
| 2022 | 7 | 3 | 0 | 10 |
| 2023 | 7 | 2 | 0 | 9 |
| 2024 | 5 | 3 | 0 | 8 |
| 2025 | 9 | 3 | 1 | 13 |
Counts are units that are marked FID today, in whatever status they hold now: a unit cancelled after its decision is still counted in the year of that decision. Earlier years show few units because most older operating units have no FID status recorded at all, not because few decisions were taken.
Decisions planned, by year
Units still proposed that are marked pre-FID, by the year their developers plan to decide. 6 more are pre-FID with no planned year.
| Planned FID year | Export units | Import units | All units | Compared with the release |
|---|---|---|---|---|
| 2008 | 1 | 0 | 1 | Already past |
| 2021 | 3 | 0 | 3 | Already past |
| 2022 | 1 | 3 | 4 | Already past |
| 2023 | 6 | 3 | 9 | Already past |
| 2024 | 5 | 0 | 5 | Already past |
| 2025 | 25 | 6 | 31 | Year of the release |
| 2026 | 12 | 2 | 14 | Still ahead |
| 2027 | 1 | 0 | 1 | Still ahead |
| 2028 | 3 | 0 | 3 | Still ahead |
22 of these 71 units name a year before 2025 and are still proposed: a plan that slips is ordinary in this industry, and the table shows how much of the pipeline is in that state. It is not a forecast of what will be decided. For how plans move, see the construction timeline and build times.
Where units stand today
Units that report FID status, by their status now. Current status only: it does not say why a unit stopped.
| Status today | Marked FID | Marked pre-FID | ||
|---|---|---|---|---|
| Export | Import | Export | Import | |
| Operating | 23 | 12 | 0 | 0 |
| Under construction | 27 | 10 | 4 | 0 |
| Proposed | 10 | 3 | 62 | 15 |
| Idle | 2 | 1 | 0 | 0 |
| Shelved | 2 | 0 | 5 | 4 |
| Cancelled | 1 | 2 | 21 | 2 |
Units of a type that is neither export nor import are not shown. A unit marked pre-FID and under construction is as GEM reports it; the two fields are not reconciled here. GEM infers shelved after two years without development updates and cancelled after four; see cancelled and shelved.
How long a decision takes
Years from the year proposed to the year of FID, and from the year of FID to the year the unit started operating, for units that report both years. A group shows a summary from five units.
From proposal to FID
| Group | Units | Median | Middle half | Shortest to longest |
|---|---|---|---|---|
| Export (liquefaction) | 22 | 1.5 years | 1 year to 3.8 years | 0 to 11 years |
| Import (regasification) | 20 | 1.5 years | 0 years to 4 years | 0 to 7 years |
From FID to operation
| Group | Units | Median | Middle half | Shortest to longest |
|---|---|---|---|---|
| Export (liquefaction) | 19 | 5 years | 3 years to 6.5 years | 1 to 7 years |
| Import (regasification) | 12 | 3 years | 2 years to 4 years | 1 to 6 years |
Only operating units can be timed from FID to start, so these are the units that were finished. Floating units are not split out here because too few report both years; the build times page separates them. To read what an FID means, see the guide to reading a final investment decision.
Common questions
Each answer stands on its own.
- In which year were the most LNG units taken to final investment decision?
- 2025, with 13 units (9 export, 3 import) among the 87 units that report both a final investment decision and its year in the September 2025 release. A unit is one train or phase, so a single plant can add several.
- How many LNG units are marked as having reached FID?
- 94 of 1,206 units, and 113 more are marked pre-FID. The other 999 are blank, which GEM defines as no information on FID, not as a decision that has not been taken. Most operating units are blank, because their decision was taken long ago and was never recorded.
- How long does it take from FID to start-up?
- Among operating units that report both years, the median is 5 years for export (19 units) and 3 years for import (12 units). Only units that were finished can be timed, so this leaves out any that stalled after FID. Years are whole calendar years, so a figure can be a year out either way.
- What does a planned FID year mean?
- For a project marked pre-FID, GEM gives the year its developers plan to reach FID. It is a plan, not a forecast: 22 of the 71 proposed units that give one name a year before 2025, so the date has already gone by without the status changing.
- Does reaching FID mean a plant gets built?
- Mostly, in this data, but not always. 8 of the 94 units marked FID are now idle, shelved or cancelled; the outcomes table gives every status. It records current status only and does not say why a unit stopped.
Cite this page
Reuse is welcome; please name the page and the tracker release it draws on.