Ranking
How big LNG terminal units are
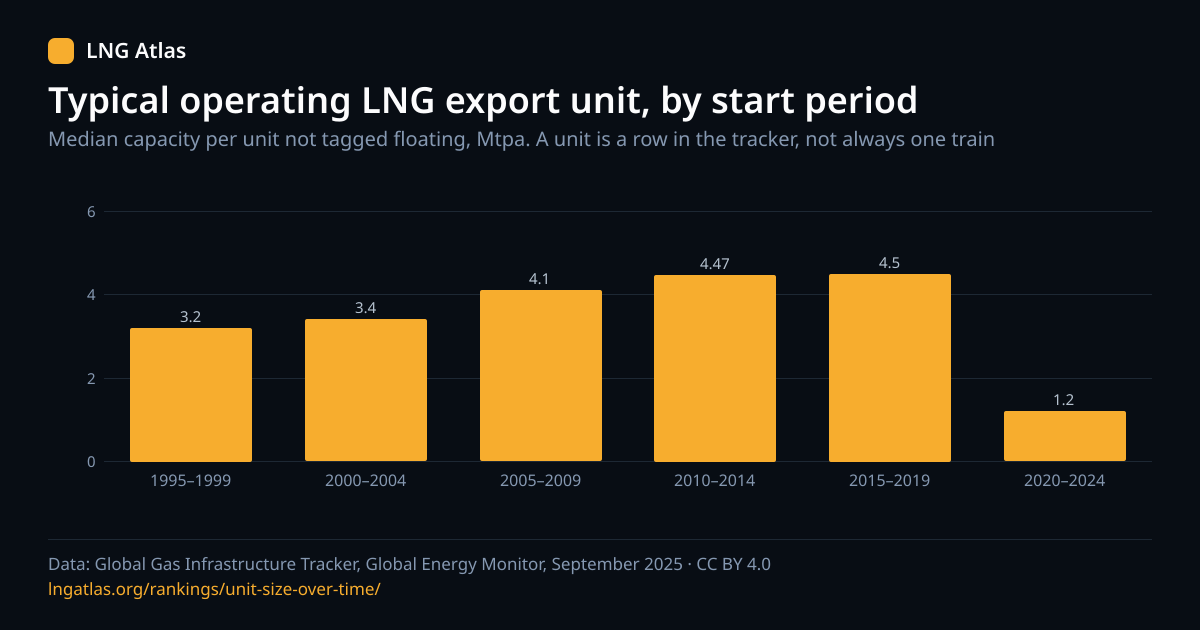
The median capacity of operating export and import units by the period they started, with floating units shown apart.
Units as GEM lists them, in service now
The tracker lists 127 operating export units and 247 operating import units. A unit is a row in the tracker, not always a single train, and only units still operating are here, so older periods describe the survivors. Units with no start year (0 export, 0 import) or no capacity (1 export, 9 import) are left out of the medians and counted, not guessed.
The figure is the median, the middle unit, not the average, and capacity is per unit in million tonnes a year. Nothing is added up. Export is liquefaction and import is regasification send-out, so the two are never combined. A median needs 5 units.
Export units (liquefaction)
Show these figures as a table
| Year | Mtpa |
|---|---|
| 1995–1999 | 3.2 |
| 2000–2004 | 3.4 |
| 2005–2009 | 4.1 |
| 2010–2014 | 4.47 |
| 2015–2019 | 4.5 |
| 2020–2024 | 1.2 |
Use this chart
Embed it on your site
The image links back to this page and carries its data attribution line; please keep both.
| Started | Operating units | Reporting a capacity | Median, all | Smallest to largest | Median, not tagged floating | Median, floating |
|---|---|---|---|---|---|---|
| 1970–1974 | 3 | 3 | Too few units | — | 3 units | — |
| 1975–1979 | 3 | 3 | Too few units | — | 3 units | — |
| 1980–1984 | 2 | 2 | Too few units | — | 2 units | — |
| 1985–1989 | 1 | 1 | Too few units | — | 1 units | — |
| 1990–1994 | 2 | 2 | Too few units | — | 2 units | — |
| 1995–1999 | 9 | 9 | 3.2 Mtpa | 2.8 to 9.6 Mtpa | 3.2 Mtpa (9 units) | — |
| 2000–2004 | 10 | 10 | 3.4 Mtpa | 0.02 to 14.1 Mtpa | 3.4 Mtpa (10 units) | — |
| 2005–2009 | 19 | 19 | 4.1 Mtpa | 0.08 to 15.6 Mtpa | 4.1 Mtpa (19 units) | — |
| 2010–2014 | 12 | 12 | 4.47 Mtpa | 0.33 to 7.8 Mtpa | 4.47 Mtpa (12 units) | — |
| 2015–2019 | 41 | 41 | 4.45 Mtpa | 0.08 to 5.5 Mtpa | 4.5 Mtpa (33 units) | 0.9 Mtpa (8 units) |
| 2020–2024 | 21 | 20 | 1.45 Mtpa | 0.25 to 10 Mtpa | 1.2 Mtpa (16 units) | 4 units |
| 2025 | 4 | 4 | Too few units | — | 3 units | 1 units |
“Not tagged floating” is every unit the tracker does not tag as floating, which is an inference from an absent tag, as on the FSRU comparison. The chart shows that column. For how capacity is spread by start year, not its median, see capacity by start year.
Import units (regasification)
| Started | Operating units | Reporting a capacity | Median, all | Smallest to largest | Median, not tagged floating | Median, floating |
|---|---|---|---|---|---|---|
| 1965–1969 | 3 | 3 | Too few units | — | 3 units | — |
| 1970–1974 | 4 | 4 | Too few units | — | 4 units | — |
| 1975–1979 | 7 | 7 | 7.9 Mtpa | 5.5 to 10.9 Mtpa | 7.9 Mtpa (7 units) | — |
| 1980–1984 | 3 | 3 | Too few units | — | 3 units | — |
| 1985–1989 | 6 | 6 | 8.7 Mtpa | 3.3 to 41 Mtpa | 8.7 Mtpa (6 units) | — |
| 1990–1994 | 6 | 6 | 2.25 Mtpa | 0.65 to 5.4 Mtpa | 2.25 Mtpa (6 units) | — |
| 1995–1999 | 8 | 8 | 2.95 Mtpa | 0.2 to 54.5 Mtpa | 2.95 Mtpa (8 units) | — |
| 2000–2004 | 10 | 10 | 5.1 Mtpa | 0.2 to 26.5 Mtpa | 5.1 Mtpa (10 units) | — |
| 2005–2009 | 28 | 28 | 5.45 Mtpa | 0.2 to 30.4 Mtpa | 5.2 Mtpa (27 units) | 1 units |
| 2010–2014 | 40 | 40 | 3.1 Mtpa | 0.1 to 11.8 Mtpa | 3 Mtpa (32 units) | 3.73 Mtpa (8 units) |
| 2015–2019 | 53 | 52 | 3.1 Mtpa | 0.1 to 10.8 Mtpa | 3 Mtpa (37 units) | 3.8 Mtpa (15 units) |
| 2020–2024 | 67 | 60 | 3.58 Mtpa | 0.17 to 22 Mtpa | 3 Mtpa (36 units) | 3.87 Mtpa (24 units) |
| 2025 | 12 | 11 | 3 Mtpa | 1 to 5.51 Mtpa | 3 Mtpa (8 units) | 3 units |
For the vessels themselves see how big LNG carriers have become.
Common questions
Each answer stands on its own.
- How big is a typical operating LNG export unit?
- Among operating export units not tagged floating that started 2020–2024, the median is 1.2 Mtpa (16 units). The median is the middle unit, so half are smaller and half larger.
- Have export units got bigger over time?
- Not in a straight line. For units not tagged floating the median is 3.2 Mtpa for 1995–1999, reaches 4.5 Mtpa for 2015–2019, and is 1.2 Mtpa for 2020–2024. The data does not say why, and what GEM lists as one unit varies from a single train to a whole phase.
- Is a unit the same as a train?
- No. A unit is a row in the tracker: one liquefaction train at one terminal, a phase of several trains at another, or a whole floating vessel. So these figures describe the units as listed, and a period with many finely split units can show a smaller median without any plant being smaller.
- How big are import units?
- Import units are regasification send-out, a different quantity from export liquefaction, so they have their own table. For units that started 2025 the median is 3 Mtpa (11 units).
- Why is there no median for some periods?
- A median appears only from 5 units; with fewer, the table shows the count and nothing else.
Cite this page
Reuse is welcome; please name the page and the tracker release it draws on.