Ranking
How big LNG carriers have become
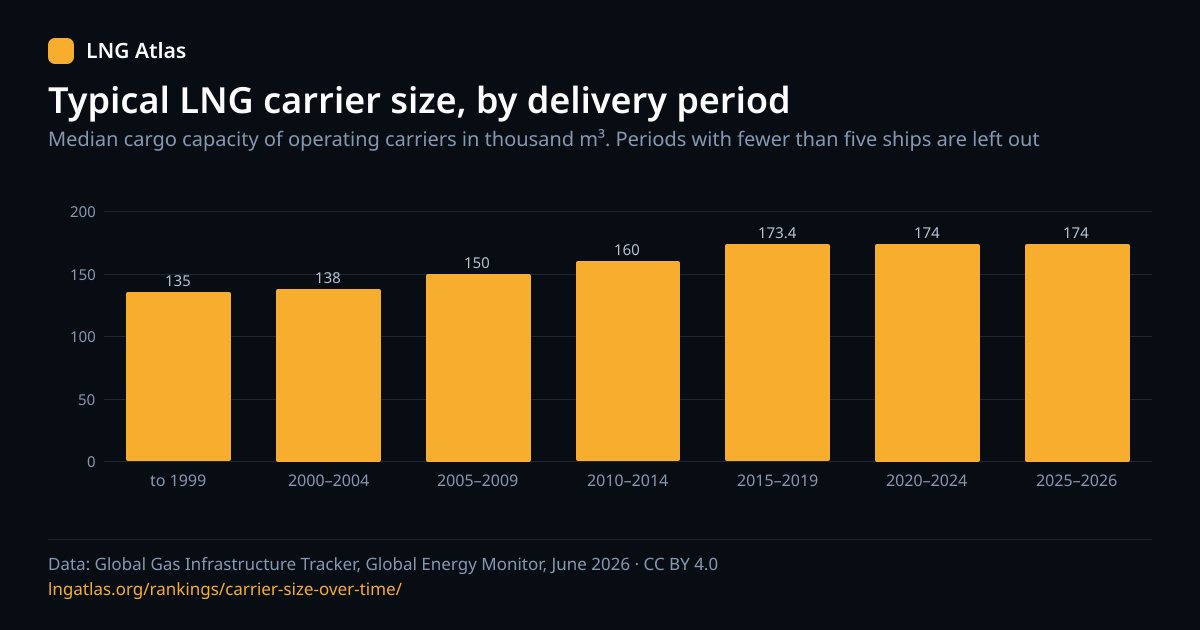
The median cargo capacity of operating LNG carriers by the period they were delivered, with membrane and Moss ships apart and the ships on order shown on their own.
Ships in service, not every ship ever built
The tracker lists 764 operating carriers with a delivery year, and all of them report a cargo capacity. Because only ships still in service are listed, older periods describe the survivors, which is not the same as the ships built then. See the fleet age page for how the fleet is spread by delivery year.
The figure is the median, the middle ship of a period, not the average. A period needs 5 ships for a median. FSRUs and FSUs are excluded.
Median cargo capacity by delivery period
Show these figures as a table
| Year | Thousand m³ |
|---|---|
| to 1999 | 135 |
| 2000–2004 | 138 |
| 2005–2009 | 150 |
| 2010–2014 | 160 |
| 2015–2019 | 173.4 |
| 2020–2024 | 174 |
| 2025–2026 | 174 |
Use this chart
Embed it on your site
The image links back to this page and carries its data attribution line; please keep both.
| Delivered | Operating ships | Reporting a capacity | Median | Smallest to largest | Membrane median | Moss median |
|---|---|---|---|---|---|---|
| 1999 and earlier | 31 | 31 | 135,000 m³ | 65,000 to 138,000 m³ | 130,000 m³ (7 ships) | 135,000 m³ (22 ships) |
| 2000–2004 | 49 | 49 | 138,000 m³ | 134,833 to 147,300 m³ | 138,000 m³ (31 ships) | 137,000 m³ (17 ships) |
| 2005–2009 | 158 | 158 | 150,000 m³ | 74,500 to 266,500 m³ | 152,800 m³ (130 ships) | 147,000 m³ (28 ships) |
| 2010–2014 | 74 | 74 | 160,000 m³ | 145,300 to 266,300 m³ | 160,000 m³ (67 ships) | 153,000 m³ (7 ships) |
| 2015–2019 | 166 | 166 | 173,400 m³ | 45,000 to 182,000 m³ | 173,400 m³ (134 ships) | 165,000 m³ (25 ships) |
| 2020–2024 | 210 | 210 | 174,000 m³ | 30,000 to 200,000 m³ | 174,000 m³ (206 ships) | — |
| 2025–2026 | 76 | 76 | 174,000 m³ | 78,900 to 200,000 m³ | 2 ships | — |
A ship with no stated containment is in the overall median but in neither of the last two columns, so recent periods, where many ships state none, rest on fewer ships there; each column shows its count. A column shows a median from 5 ships and the count otherwise. For what separates the two designs see membrane versus Moss.
Ships on order
361 carriers are under construction. They are a commitment, not fleet in service, so they are in their own table, by the delivery year GEM gives.
| Delivery year | Ships | Reporting a capacity | Median | Smallest to largest |
|---|---|---|---|---|
| 2026 | 119 | 119 | 174,000 m³ | 172,600 to 200,000 m³ |
| 2027 | 72 | 63 | 174,000 m³ | 174,000 to 200,000 m³ |
| 2028 | 101 | 90 | 174,000 m³ | 174,000 to 271,000 m³ |
| 2029 | 58 | 56 | 174,000 m³ | 174,000 to 271,000 m³ |
| 2030 | 5 | 5 | 271,000 m³ | 174,000 to 271,000 m³ |
| 2031 | 3 | 3 | Too few ships | — |
| Not reported | 3 | 3 | Too few ships | — |
For the same ships by year and capacity see the order book, and for the biggest ships already running the largest carriers.
Common questions
Each answer stands on its own.
- How big is a typical LNG carrier today?
- Among operating carriers delivered 2025–2026 the median cargo capacity is 174,000 m³ (76 ships). The median is the middle ship, so half are smaller and half larger.
- Have LNG carriers got bigger over time?
- In this data, yes. The median for carriers delivered 1999 and earlier is 135,000 m³ and for 2025–2026 it is 174,000 m³. Membrane ships alone show it too, from 130,000 m³ (1999 and earlier) to 174,000 m³ (2020–2024), so it is not only a change in the mix of designs. The data does not say why.
- Are the ships on order bigger than the ones in service?
- The medians for ships on order, by delivery year, are 174,000 m³ for 2026, 174,000 m³ for 2027, 174,000 m³ for 2028, 174,000 m³ for 2029, 271,000 m³ for 2030, with the largest single ship on order at 271,000 m³. Ships on order are a plan, not fleet in service, so they are shown apart and never averaged with the ships in service.
- Does this include FSRUs and floating storage units?
- No. FSRUs and FSUs have a storage or process capacity, not a cargo size, so they are left out as on the largest-carriers ranking. Only vessels the tracker types as carriers are counted.
- Why is there no median for some periods?
- A median appears only from 5 ships; with fewer, the table shows the count and nothing else, because a middle value of two or three ships says little.
Cite this page
Reuse is welcome; please name the page and the tracker release it draws on.